Quite a few years ago I wrote an overview article on the use of sound for representing geographic data, including a series of sound variables for mapping I developed. The article was titled “Sound and Geographic Visualization” and was published as a chapter in the now out-of-print book Visualization in Modern Cartography (MacEachren & Taylor eds., 1994).
Sound is used to convey information all the time, but less so in the realm of mapping where the visual dominates. The article explores the possibilities of making maps with sound, or using sound in tandem with a visual display to add additional layers of information.
Some work on tactile mapping had had occurred at the time the article was published, as well as a few dozen articles on sound for representing data in general (not geographic data). Subsequently, research on multi-sensory mapping has expanded but not as much as I expected. We still can’t hear data with Google Earth.
For an updated bibliography of related work, see the articles and books that cite “Sound and Geographic Visualization” at Google Scholar.
The article is below as originally published. It holds up ok, although technology has changed quite a bit.
••••••

Denis Elder emailed me (Feb 6, 2012) and asked about the “manuscript videotape” cited in the paper below. The video was made to accompany my 1993 Association of American Geographers (AAG) conference presentation on using sound with maps. Back then, showing the examples (which were created with the software Director on a Mac) live at the conference would not have been easy, so I made a video of the maps being used (and making sounds). This presentation was an early form of the work that would be published as “Sound and Geographic Visualization.”
I managed to find the video and had our media center create a digital version (in Quicktime / .mov format).
The video and the notes for the presentation (“Mapping with Sound”) are below. This is old stuff, so don’t laugh!
“Mapping with Sound.” (PDF) Presented at the 1993 Association of American Geographers Conference, Atlanta, Georgia.
“Mapping with Sound.” (Quicktime Movie, 9 minutes, 84mb) to accompany paper. Explanation of this video is in the above PDF of the paper presented at the conference. If sound does not work try the .m4v version (below).
“Mapping with Sound.” (.m4v Movie, 131.6mb). Same as above, different movie file format.
And, least and last, the 1991 seminar paper (For Mark Detweiler in Psychology 597a) that served as the basis of the Sound and Geographic Visualization book chapter: “An Elemental Approach to Animation and Sound in Information Graphics” (PDF, 1mb)
••••••
Sound and Geographic Visualization
“Who the hell wants to hear actors talk?”
Harry Warner on being confronted with the prospect of the sound movie.
Introduction
The issue of sound in the context of visualization may at first seem incongruous. There is, however, evidence to support the claim that sound is a viable means of representing and communicating information and can serve as a valuable addition to visual displays. Abstracted two-dimensional space and the visual variables – the traditional purview of cartography – may not always be adequate for meeting the visualization needs of geographers and other researchers interested in complex dynamic and multivariate phenomena. The current generation of computer hardware and software gives cartographers access to a broadened range of design options: three-dimensionality, time (animation), interactivity, and sound. Sound – used alone or in tandem with two-or three-dimensional abstract space, the visual variables, time, and interactivity – provides a means of expanding the representational repertoire of cartography and visualization.
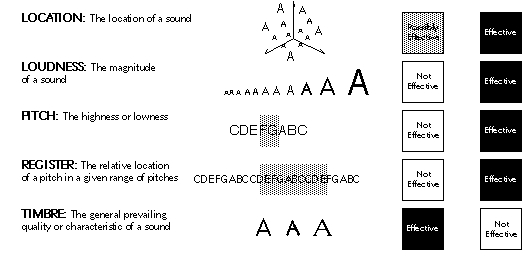
This chapter discusses the use of realistic and abstract sound for geographic visualization applications. Examples of how and why sound may be useful are developed and discussed. Uses of sound in geographic visualization include sound as vocal narration, as a mimetic symbol, as a redundant variable, as a means of detecting anomalies, as a means of reducing visual distraction, as a cue to reordered data, as an alternative to visual patterns, as an alarm or monitor, as a means of adding non-visual data dimensions to interactive visual displays, and for representing locations in a sound space. The chapter concludes with research issues concerning sound and its use in geographic visualization.
Experiencing and Using Sound to Represent Data
Our sense of vision often seems much more dominant than our sense of hearing. Yet one only has to think about the everyday environment of sound surrounding us to realize that the sonic aspects of space have been undervalued in comparison to the visual (Ackerman 1990, Tuan 1993). Consider the experience of the visually impaired to appreciate the importance of sound and how it aids in understanding our environment. Also consider that human communication is primarily carried out via speech and that we commonly use audio cues in our day to day lives – from the honk of a car horn to the beep of a computer to the snarl of a angry dog as we approach it in the dark (Baecker and Buxton 1987).
There are several perspectives which can contribute to understanding the use of sound for representing data. Acoustic and psychological perspectives provide insights into the physiological and perceptual possibilities of hearing (Truax 1984, Handel 1989). An environmental or geographical perspective on sound can be used to examine our day to day experience with sound and to explore how such experiential sound can be applied to geographic visualization (Ohlson 1976, Schafer 1977, Schafer 1985, Porteous and Mastin 1985, Gaver 1988, Pocock 1989). Understanding how sound and music is used in non-western cultures may inform our understanding of communication with sound (Herzog 1945, Cowan 1948). Knowledge about music composition and perception provides a valuable perspective on the design and implementation of complicated, multivariate sound displays (Deutsch 1982). Many of these different perspectives have coalesced in the cross-disciplinary study of sound as a means of data representation, referred to as sonification, acoustic visualization, auditory display, and auditory data representation (Frysinger 1990). Within this context both realistic and abstract uses of sound are considered.

