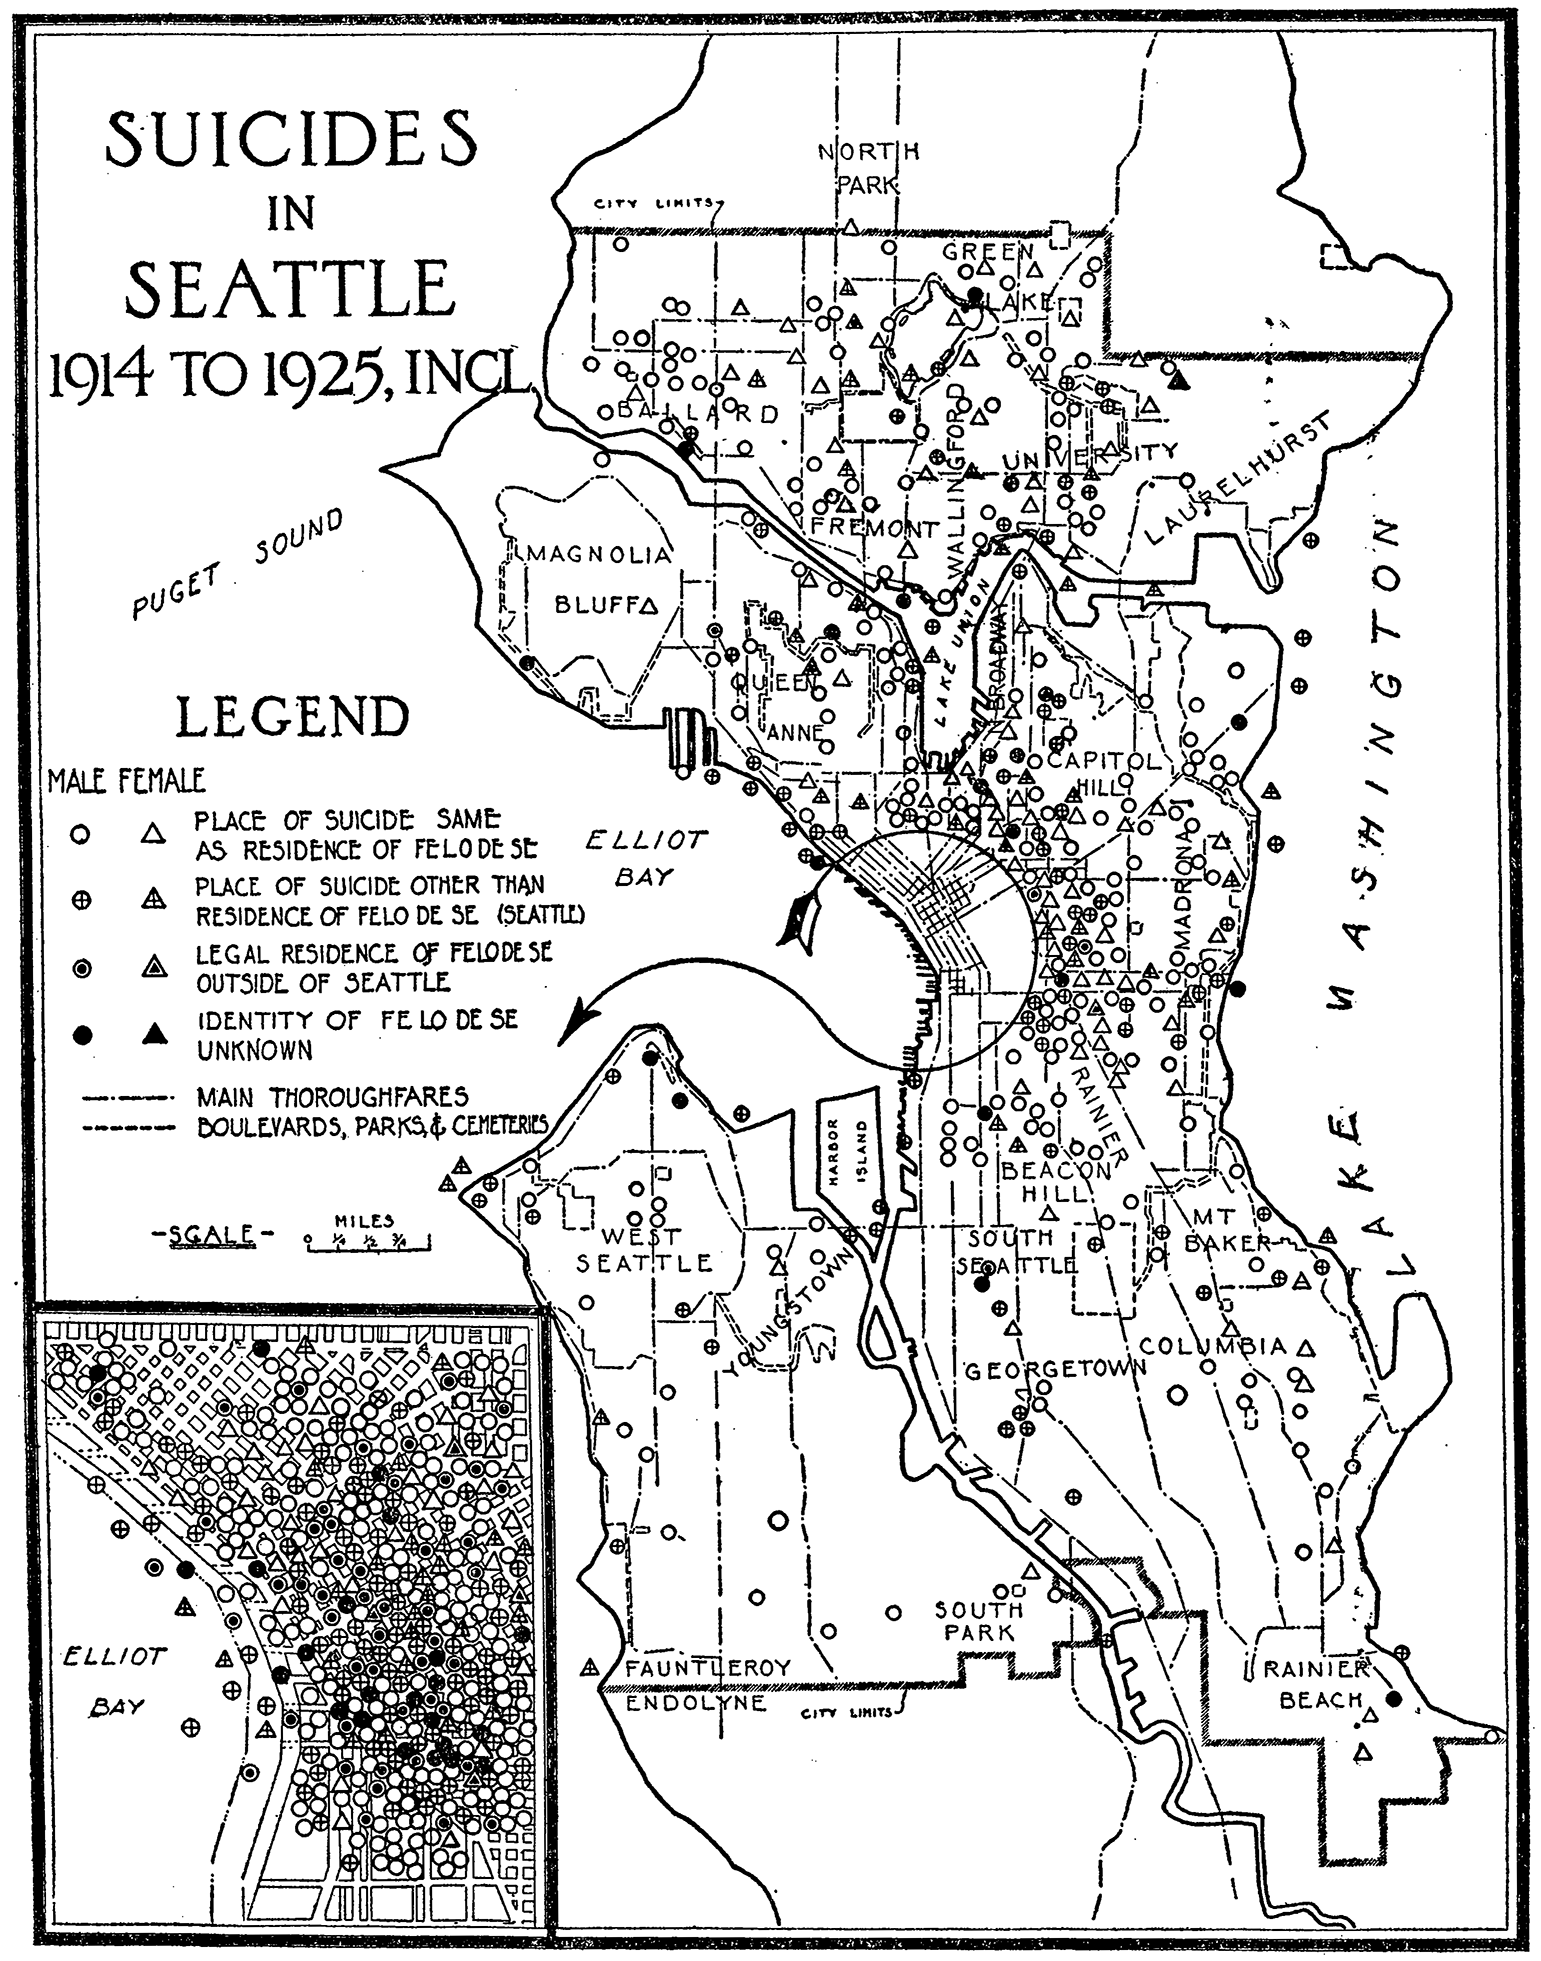
In the field of sociology, perhaps one of the most useful devices for the graphic presentation of facts is the cartogram or statistical map. Recently there has been an increasing emphasis on the ecological and statistical phases of social analysis. This development has given the map much greater significance and utility in the methodology of sociology.
The chief value of the spot-map, though not highly refined or developed at present, seems to be that of an instrument of social discovery and analysis. Significant relations and correspondence of variables, which might otherwise be overlooked, are brought into graphic relief by the spotmap.

Notwithstanding that the spot-map is characteristically quite elementary, if not, as some critics say, superficial, yet it can be delineated so that it shows several variables at once with specificity, accuracy, and clarity.
Although the spot-map has its limitations, it is justifiable to say that there is no other way in which the relation between so many facts as are contained in the above maps can be shown so clearly and concisely.
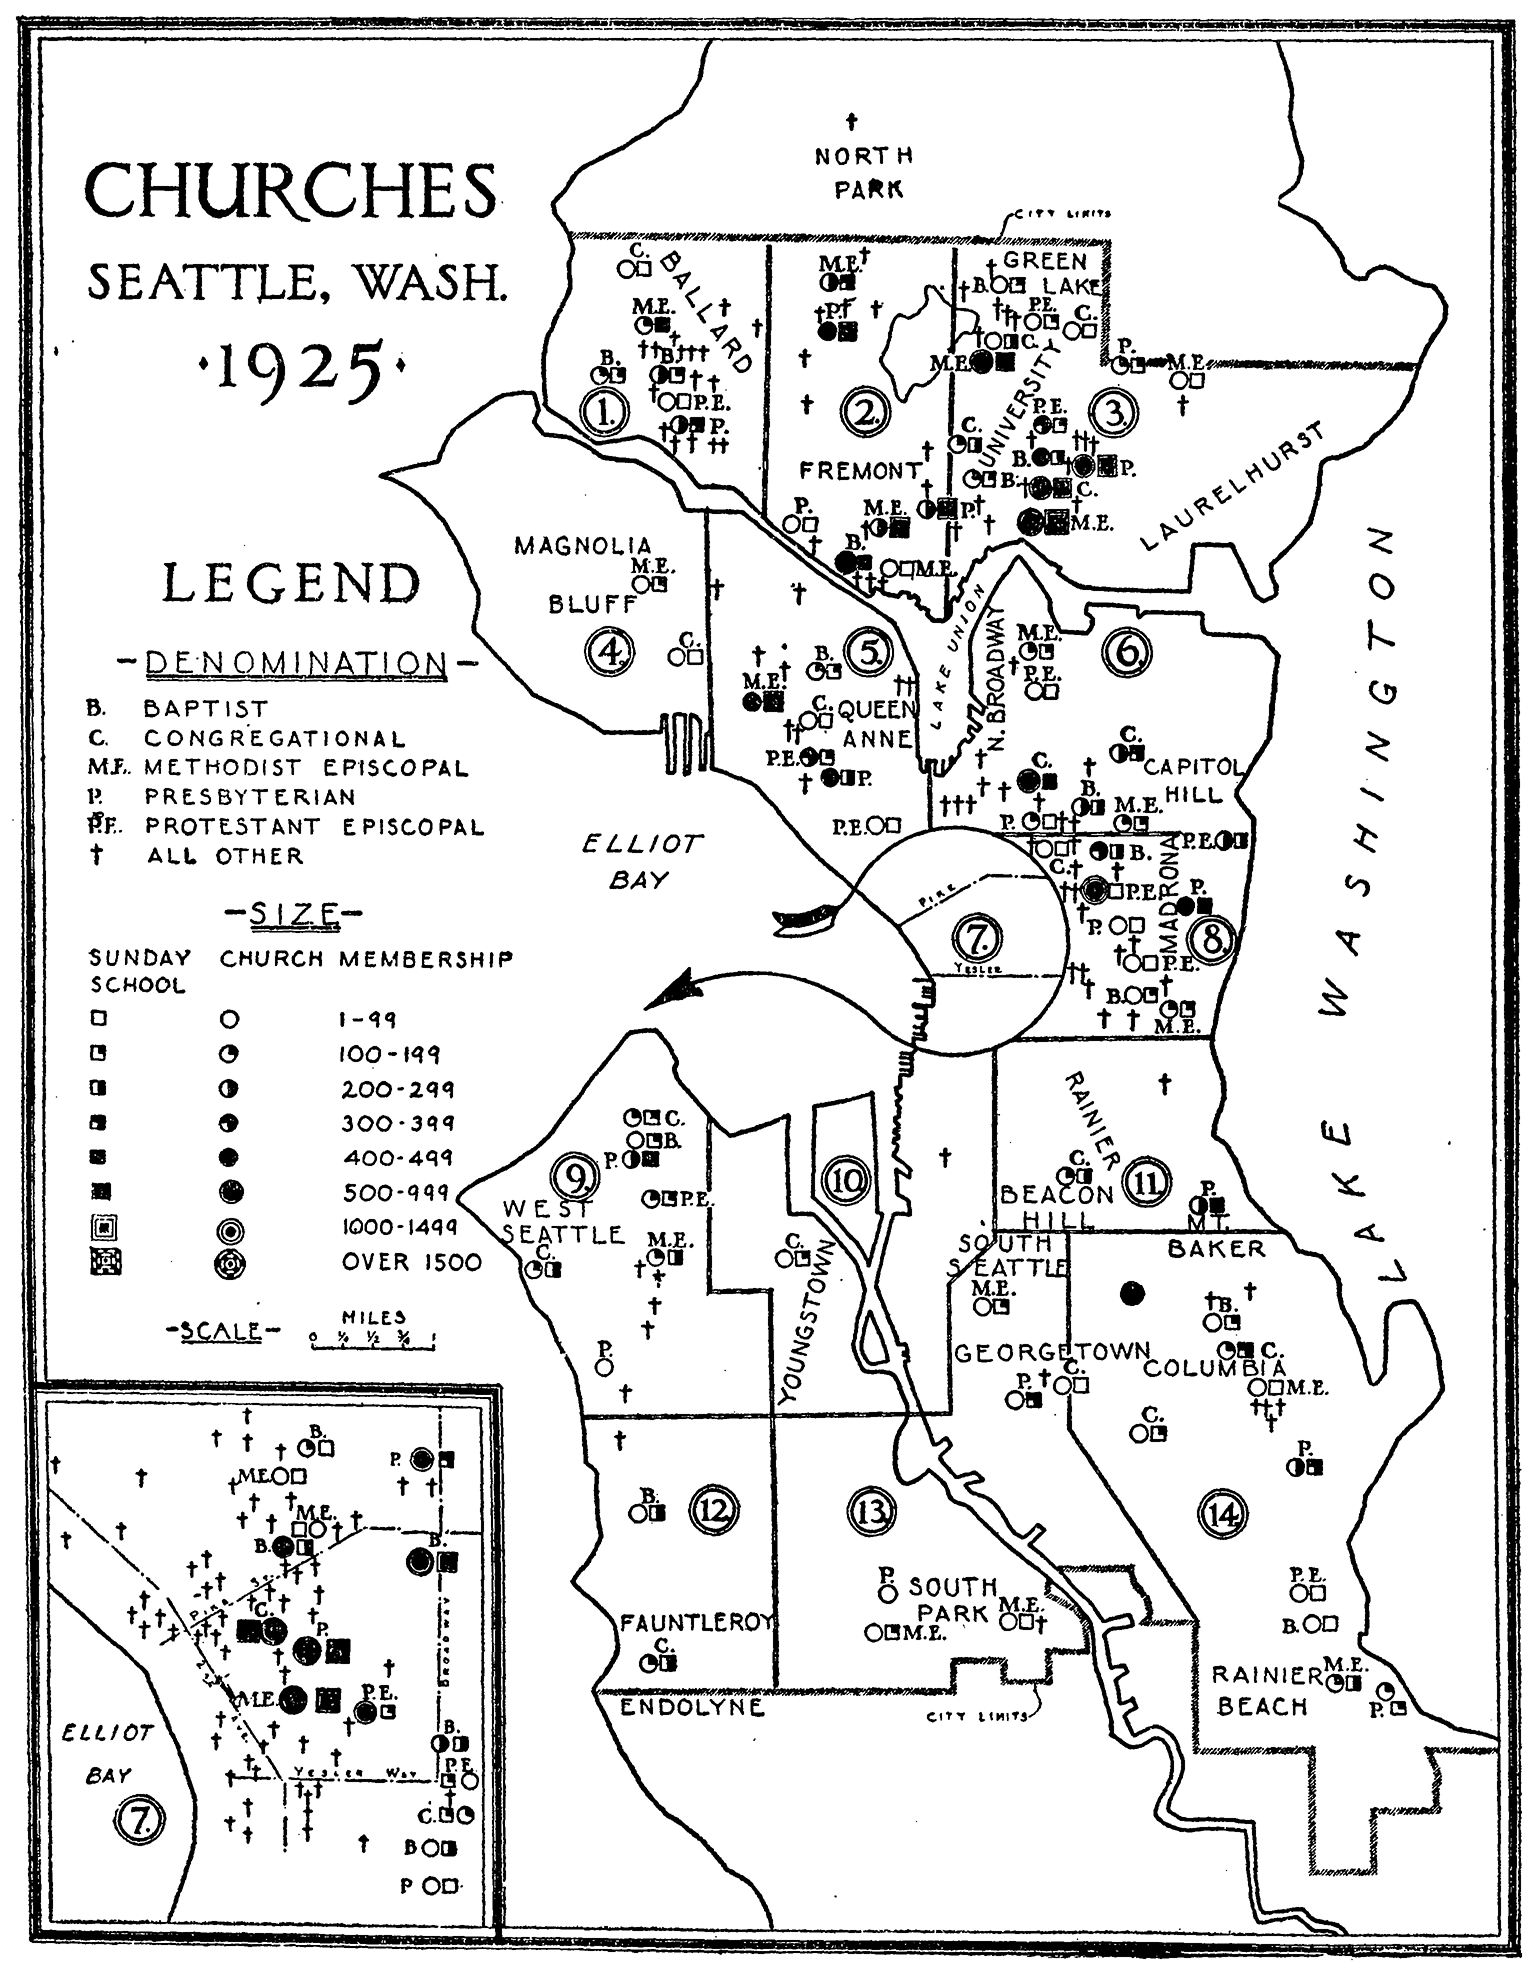
It may be argued that a large number of symbols tends to obscure rather than to elucidate the significance of the data, and at the same time necessitating an unduly large amount of time and effort. This point of view may, in some instances, be justified, but if the number of symbols is reasonably large, and if they are simple in form and logically and visually arranged, this argument becomes untenable.
Calvin F. Schmid
“Notes on Two Multiple-Variable Spot Maps”
Social Forces, Vol. 6, No. 3. (Mar., 1928), pp. 378-382.
.

Choice item, JBK! And I learned an archaic term for ‘suicide’. Thanks.
The chief value of the spot-map, though not highly refined or developed at present, seems to be that of an instrument of social discovery and analysis
Interesting information about maps and nice hand made exampe, very different comparing with present web maps.