Feeds:
Posts
Comments

Archive for September, 2007

flat-earth1.jpg

What if the world was spherical, but it didn’t matter?

Most of you have been unable to avoid the flat-earth kerfuffle on the day-time talk show The View.

On a recent episode one of the hosts, Sherri Shepherd, said she doesn’t believe the theory of evolution. Whoopi Goldberg, also a host, asked Shepherd “Is the world flat?”

Shepherd’s response was “…I Don’t know. I… I never thought about it, Whoopi. Is the world flat? I never thought about it.”

Most maps show the earth as flat. Map projection is the process whereby the surface of the 3D earth is transformed into 2 dimensions. A flat earth is usually more useful than a spherical one.

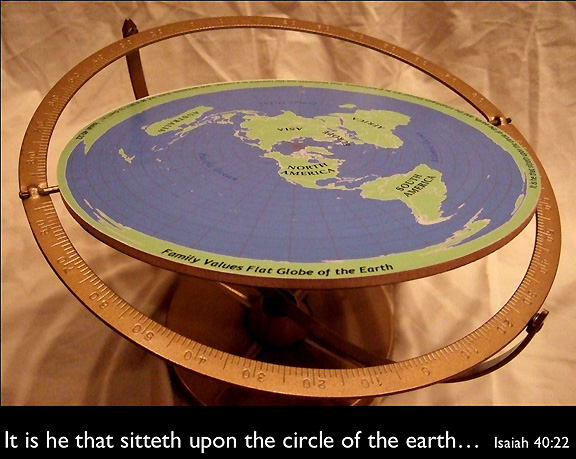
Awhile back I made a flat-earth globe for folks like Ms. Shepherd. It is a globe designed for niche cosmologies.

More images and basic instructions for making your own flat-earth globe below.

(more…)

Read Full Post »

typewriter-map-symbols.jpg

Map-making has often adapted technologies designed for purposes other than making maps.

I recall Scitex hardware as the state-of-the-art in large format color computer mapping in the early 1980s when I was first learning cartography. Cartography applications were developed when Scitex, its origins in designing and printing textiles, noticed “the similarity between printing large fabric surfaces and coloring topographic surfaces.” (PDF source).

Step back a few generations and we find the then ubiquitous typewriter adapted to making maps by DIY cartographers.

(more…)

Read Full Post »

thresholds.jpg

Cartographers have long been concerned with how map-readers perceive map symbols. How small can a map symbol be and still be noticed? What size do symbols have to be for a viewer to differentiate and clearly distinguish different shapes or forms? Such questions can be answered by using psychological methods of evaluation, as discussed in my previous post on the Perceptual Scaling of Map Symbols, or based on the experience of skilled map makers.

Examples of some thresholds of map symbol perception are illustrated by Prof. E. Spiess in a chapter entitled “Map Compilation” in the out-of-print book Basic Cartography, Vol. 2 (International Cartographic Association, 1984). At the time Spiess was the Director of the Department of Cartography at the Swiss Federal Institute of Technology.

Note: the illustrations below are guidelines for printed maps. Typically, increase sizes for computer displays. The illustrations have been slightly expanded in size from the originals to make them readable on a computer screen. Click on the image for a larger version. Illustrations are for educational purposes only.

(more…)

Read Full Post »