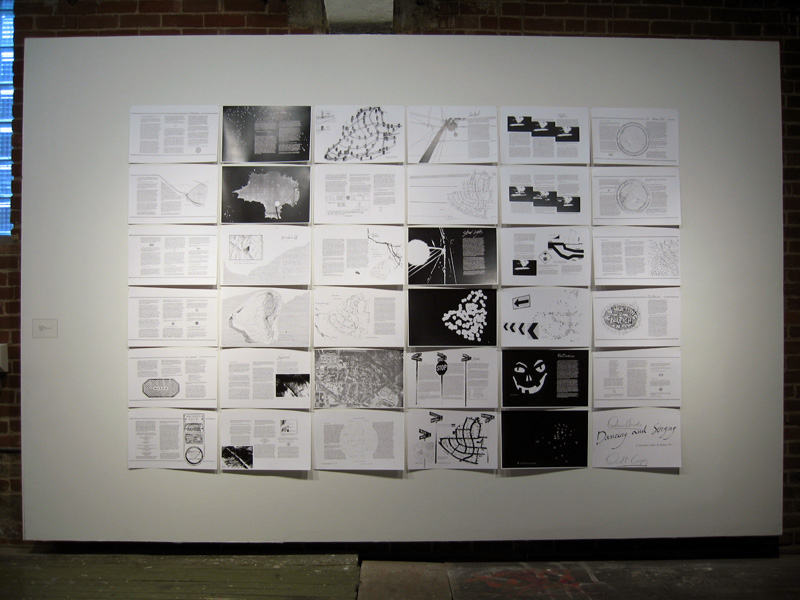
Denis Wood, co-author of Making Maps, has been working on an atlas of the Boylan Heights neighborhood in Raleigh, North Carolina since the mid 1970s. The atlas, which has never been published in its entirety, is called Dancing and Singing: A Narrative Atlas of Boylan Heights.
Inspired by Bill Bunge’s radical cartography in the 1960s and 1970s, the atlas contains diverse examples of creative, place-inspired maps, including maps of night, crime, fences, graffiti, textures, autumn leaves, routes, the underground, lines overhead, stars, and jack-o-lanterns. The atlas is of particular interest to those engaged in planning, urban history, urban geography, landscape architecture, participatory mapping and GIS, subversive cartography, counter-mapping, and psychogeography. Or anyone who enjoys creative mapping.
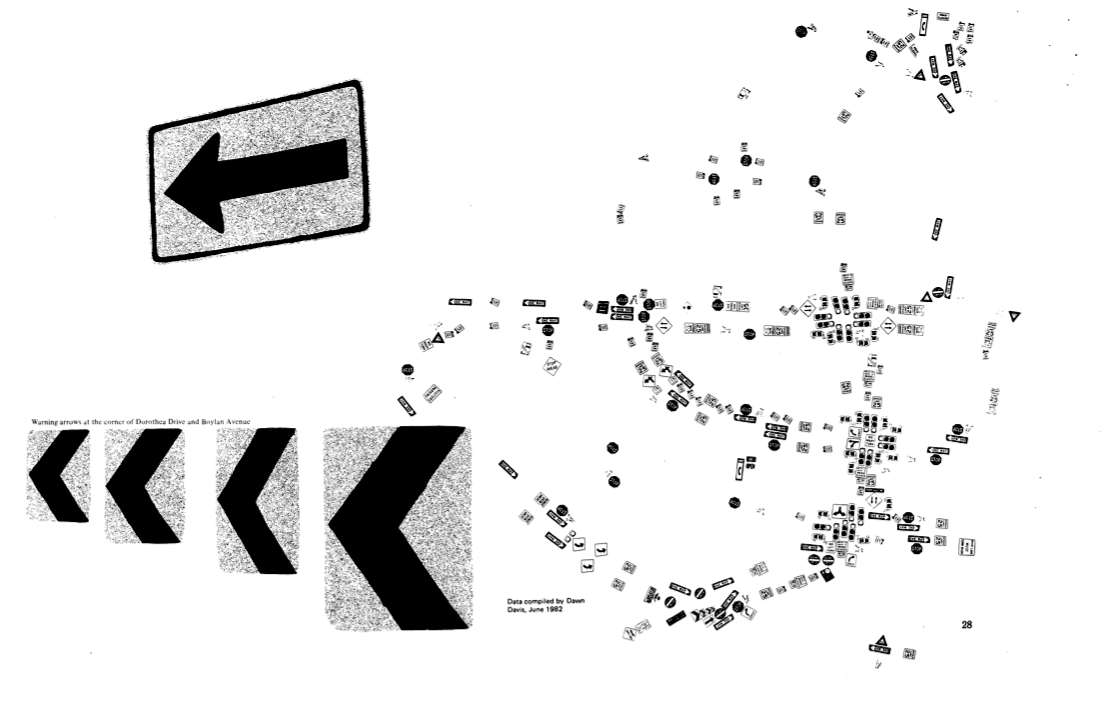
Sign Map (736kb PDF here)
The Atlas has been featured on NPR’s This American Life and in Katharine Harmon’s book You Are Here. All or or parts of the atlas have been shown at The Brattleboro Museum and Art Center, Brattleboro, Vermont (1989), the Tang Teaching Museum at Skidmore College in Saratoga Springs, New York (2001), at SCI-Arc in Los Angeles (2002), at Colby-Sawyer College in New London, New Hampshire (2002), at designbox in Raleigh, North Carolina (2004), and Publico Galleries in Cincinnatti, Ohio (2007). The image which opens this entry was taken at the Publico Gallery.
A description of the atlas by Denis and more of it’s maps follow.
I began the atlas in 1975 when I started teaching landscape architecture studios. I knew nothing about landscape architecture but I was a geographer. I thought I might help my students learn something about how to read the landscape by focusing hard on a small piece of it.
For a lot of reasons I picked the neighborhood I lived in. One of the things my students and I ended up doing was mapping a lot of its less obvious aspects. Out of this work, and the example of the radical geographer, Bill Bunge, and his mapping of the neighborhoods of Detroit, came the idea of making an atlas of Boylan Heights.
I pursued the idea off and on more or less seriously with different groups of students through the early 1980s. Then, in a series of studios and seminars, a handful of students joined me in a major effort to get something done.
There was a lot we wanted to do. Certainly we wanted to use the mapping to help us figure out what a neighborhood was, but we also wanted to use the mapping as a kind of organizational tool, as a way of bringing the neighborhood together and helping it to see itself. This meant we wanted to be able to get copies of the atlas into the hands of the residents and so we planned a black and white atlas that could be cheaply reproduced on a copy machine. At the same time we wanted to make something beautiful, almost a livre d’artiste. I in particular was impatient with distinctions between art and science – it was an important part of my teaching that these distinctions were arbitrary and obfuscatory – and I wanted the atlas to read almost like a novel.
One outcome of this was a paper I presented at the Schools Atlas Conference in Calgary in 1986, “Pleasure In the Idea: The Atlas As Narrative Form” (9.2mb PDF here.) (Cartographica, 24(1), Spring, 1987, pp. 24-45). Here I wrote about the narrative structure of atlases, and advocated making explicit what is usually implicit.
Sadly enough this paper may have been the only material outcome of the atlas project. Our energy flagged (or it was diverted) and the project ended up in boxes (lots of boxes) shoved under a table. Little work has been done on the project during the past fifteen years.
I think these boxes would still be under the table were it not for Ira Glass and This American Life. It was 1998. Ira wanted to do a show about maps. Ira’s producer learned about me from my cartographic rant, The Power of Maps (Guilford 1992). I was to give the show background and history. Ira must have assumed I also made maps, because after a long interview about the ground covered in my book, he asked about the maps I made.
I don’t make maps. I certainly never thought about myself as a mapmaker. Except for little sketch maps to give people directions, these maps of Boylan Heights are about the only maps I’ve done. When Ira asked about my mapmaking, it was these that came to mind. Ira so loved what I was saying that a second interview unfolded from the first, and that was the stuff he used for the show.
This American Life has a website and the show’s producer wanted maps to put on it. I’m not kidding when I say the maps were in boxes under a table, in a bunch of boxes under a table, this stuff jumbled up there, that here. Any remnant order had been destroyed when I’d moved my office. The show proved popular and has been replayed often during the past ten years.
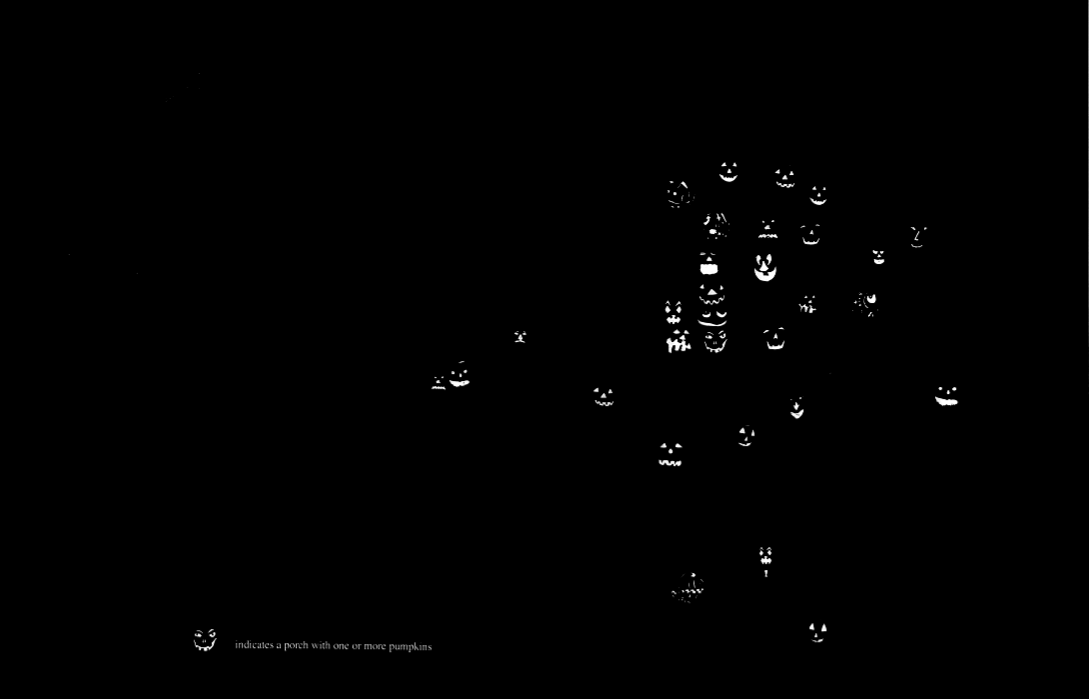
Jack-o-lantern Map (2.8mb PDF here)
The atlas was going to be three sections, corresponding to what we’d decided neighborhoods did. This was to transform universal stuff – things in general – into particular things, into the ding an sich. And vice versa.
For openers a section concerned with stars and sunlight, rock and water, leaf and tree … in general. Except for the map of pumpkins, the maps we completed are from this section.
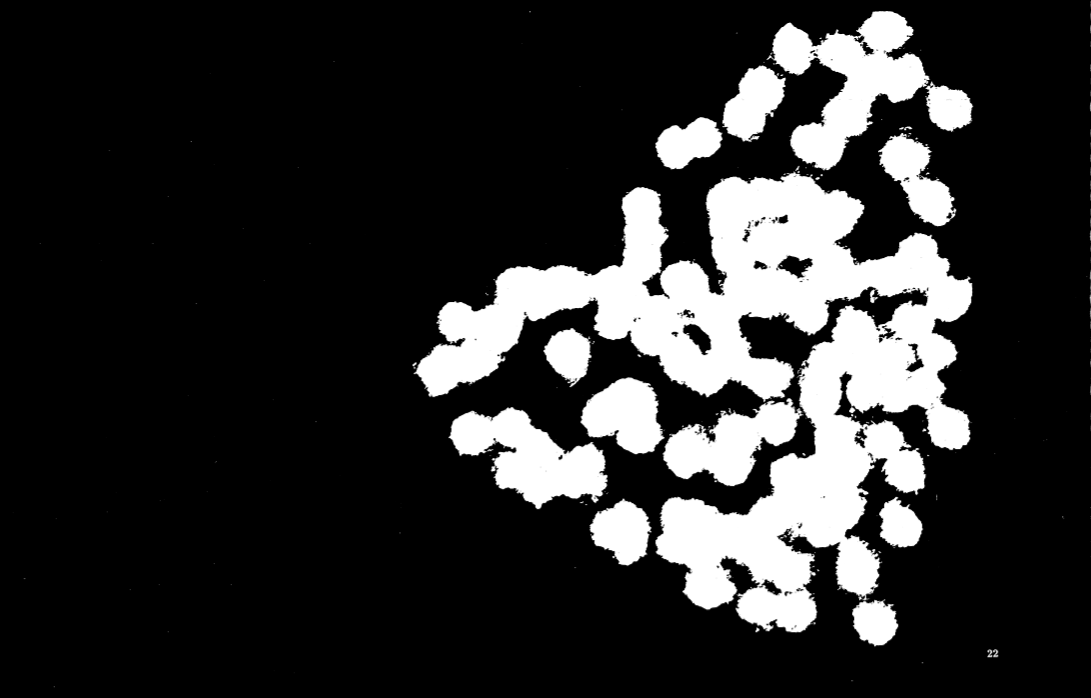
Street Light Map (2.6mb PDF here)
For closers a section concerned with the same things but … as they uniquely manifest themselves in their individuality, which is where the pumpkins would have been. In this section we’d concern ourselves with this shadow cast by this streetlight on this sidewalk at this moment. One night we walked the neighborhood with a light meter – it took hours – recording tiny incremental changes in light levels. From this we drafted (but never finished) a map of the light at night (different from the streetlight map which is no more than a map of the locations of the streetlights). As part of the spread we’d planned a very detailed rendering of a single block face. The background would consist of a photographic image of individual shadows on an individual sidewalk. It would be like … zooming in on the pattern.
In between these general and particular sections came the transformer section. At issue here was how Boylan Heights transformed a citizen of Raleigh (someone who could vote in its elections) into a unique individual (who had brown hair and green eyes and so on) and who lived here (at this unique address); precisely as the neighborhood transformed this individual, by dint of living at that address in Boylan Heights, into a citizen of Raleigh (just one of many). This section would have had a strongly processual, indeed historical character.
Among other things, we’d compiled a record of every property transaction from the subdivision of the original plantation grant to the present (this in the late 1970s (it would have to be updated (which at this point would not be easy (but extremely interesting)))).
We envisioned 64 double-page spreads, close to a hundred maps altogether, maybe more. In addition to those here, and more or less at random: sounds (walking the neighborhood with a sound meter, et cetera), mentions in the neighborhood newsletter, crime, fences, sidewalk graffiti, viewsheds (what of the rest of the city can be seen from any location in Boylan Heights), housetypes, yard furniture, landscaping, property values, property ownership, trees by category and species (many maps), the embeddedness of the neighborhood in other zones and districts (police precinct, school attendance zones, voting precincts, et cetera), time-space maps (of the paperboy’s route, the mailman’s route, city bus routes, et cetera), magazine subscriptions (we’d done an elaborate door-to-door survey in 1976, some of which we replicated in 1982 (it’s time to do it again)), weather, the color of the leaves in the fall …
There were going to be a lot of historical maps.
I’d mounted an insolometer on my roof to measure incoming solar radiation.
No wonder we ran out of energy!!
Let me describe some of the maps in a little more detail.
Light at Night Map: As I mentioned, we walked the neighborhood one long night with a light meter, noting our readings on a large scale map of the neighborhood we’d cut into smaller sheets. We never got around to reducing the data to the smaller scale the atlas would require, but I did make the light contour map for the 300 block of Cutler Street, and have blown up the photo for the background. It would be – could be – a neat spread.
Crime Map: We copied off the police blotter for the six months July to December 1981, and using the cops’ codes worked them into a map. The size of the number denotes the frequency at that location of that type of call. A 17 is a motor vehicle accident. A 16 is a vehicle blocking the flow of traffic. As you’ll see on the map of street signs, there are a lot at one intersection. No surprise that this is also the corner where there were lots of problems with cars (at the time, U.S. 64 and 70 turned 90º here).
From our perspective the maps of crime, street signs, and traffic were about the world … passing through the neighborhood.
Fences Map: Originally students designed their own map pages. Helen Waldrop drafted the map of the neighborhood’s fences which we’d have reworked for the atlas.
Sidewalk Graffiti Map: Susan Edwards drafted the map of sidewalk graffiti, all of which had been made in wet concrete. Naturally we made rubbings of all of them.
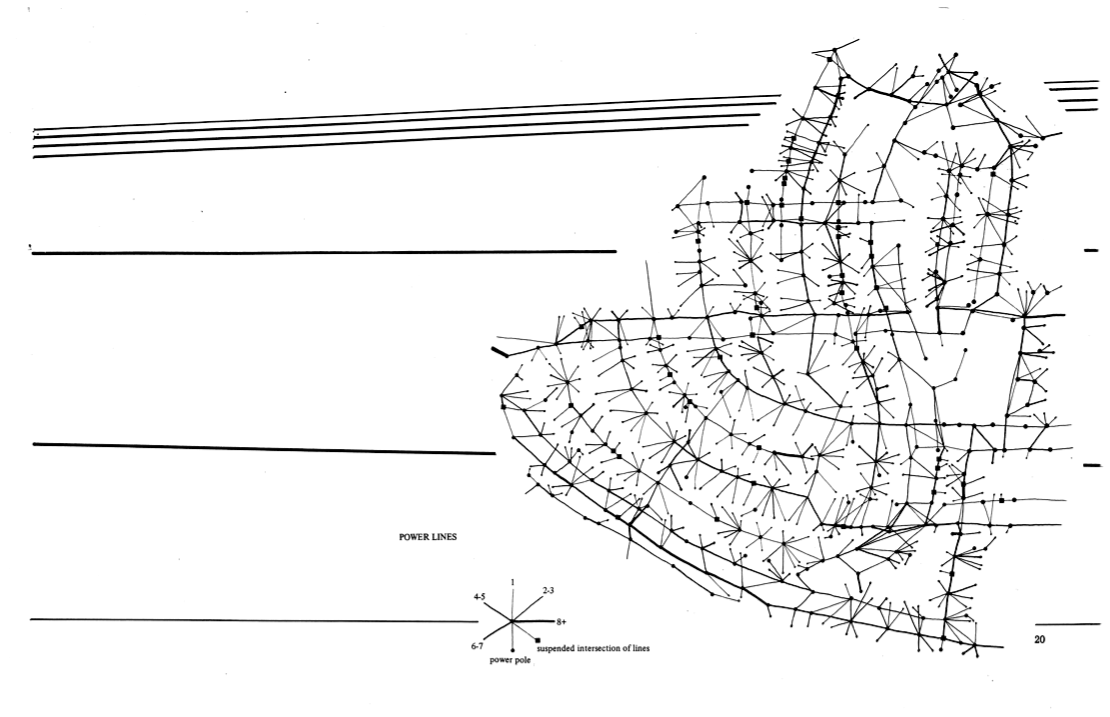
Lines Overhead Map (484kb PDF here)
Lines Overhead Map: Shaub Dunkley, our tree man, made the first attempts at this. What to show? There are as many things going on overhead as underground: electric, telephone, cable. How to get the data? The utilities map this stuff all the time, but the maps are proprietary. Finally Carter Crawford, a student, and I just went out and mapped the whole neighborhood. I’ve got this raw data. Also a couple of sheets of corrections following further field work. Still, what to show? And how? A graduated circle map might have made the relative density of connections most clear, but it wouldn’t have … gotten to the wires. Stubbed wires … Then the magical diagram which, while perhaps harder to interpret quantitatively, actually makes it most clear … what’s overhead.
Textures Map: For our Textures map we rubbed lots of “regular” sidewalk, house siding, tree bark, and all the manhole covers et cetera (some of which, radically reduced, appear in the text as breaksigns). The map itself is hard to visualize.

Stars Map (4.1mb PDF here)
Stars Map: I knew I wanted to situate Boylan Heights in everything, that is, in the universe, but it wasn’t simple to figure out how to pull this off. When it came to us to map the stars as they spread themselves over the neighborhood we knew it was right – the stars in the neighborhood – but it sounds easier to do than it was. Armed with a magnetic compass we lay down in the middle of the intersection of Boylan Avenue and Dupont Circle and looked up at the sky. We did a rough sketch of the horizon – fumbling flashlights – and the stars. A couple of days later we lay down in the intersection in the middle of the afternoon to get the horizon in finer detail. What we were trying to do was a kind of fish-eye view, splashing up out of the neighborhood into the night sky. Using an atlas of star positions we improved our plotting of the night sky. This was not easy either because the projection we were making and the projection the star atlas used were very different. We pulled the rest of the stars from Galileo’s Sidereus Nuncius both because they are so beautiful and because I liked the way Galileo integrated text and image. Crawford did the drawing, laid out the spread, and did the photomechanical work.
Mentions in the Newsletter Map: Our big discovery here was how important the address was. It didn’t matter who lived at the most frequently mentioned address. Whoever it was, was always most frequently mentioned. This took us into the social geography of the neighborhood, and how it maintained the social structure built into the neighborhood by its original planners (which was reflected by the distribution of pumpkins at Halloween and everything else).
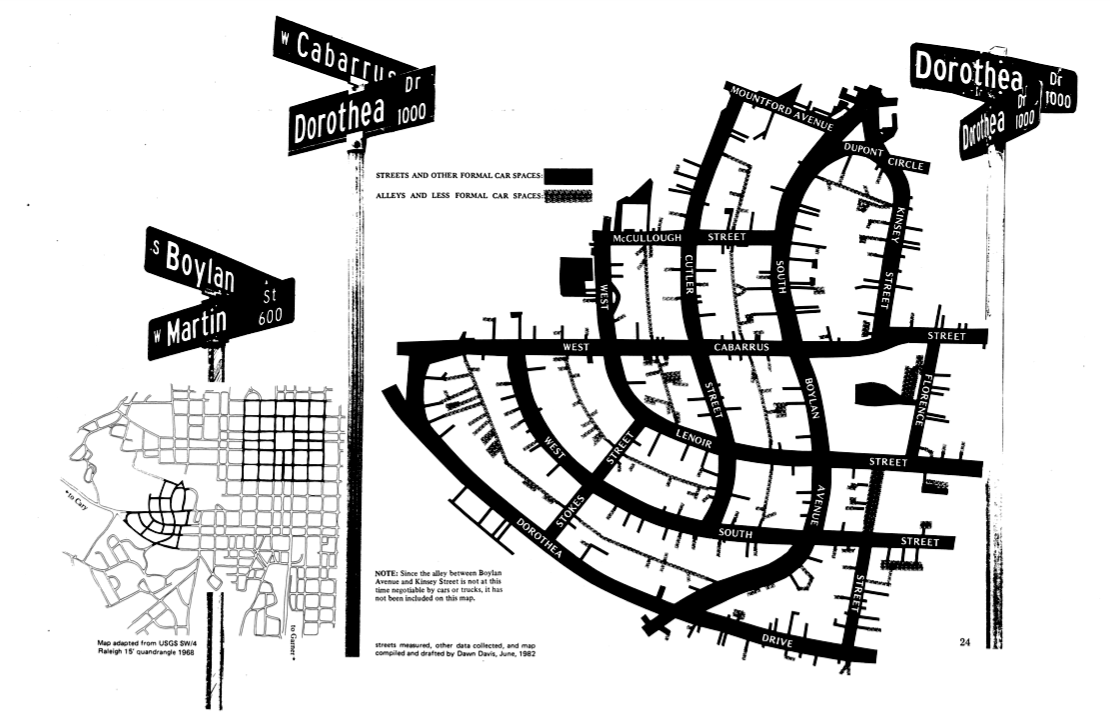
Car Space Map (1.6mb PDF here)
Autumn Leaves Map: We simply walked the neighborhood annotating the leaf color on a sheet of trace layered over one of Shaub Dunkley’s maps of the trees in Boylan Heights. Shaub was the tree man on our team. How to display this? I transformed the color image into color names and began laying these down on the compositor. Then I thought, maybe use the word “leaves” and vary the typeface to indicate the color. I’d have gone with the color names. It would have made a gorgeous map and piece of concrete poetry. A compositor was a special IBM typewriter you could “set type” on. I should say that we had no computers. Boy, that’s a revolution that’s come through fast! I did all the autumn leaves stuff.
Routes, Time-space Maps: We did a lot of work on this, but finished none of it. One was a map of a paper route, with a black dot representing one newspaper passing through the neighborhood. It started with Scott Lameroux’s route. Scott delivered bundles of Raleigh Times to paperboys. (The Times is no longer published. How time flies!) Scott ran through the neighborhood to drop a bundle of papers in front of Lester Mim’s house (where the black dots begin to rise vertically). Scott left the neighborhood with no black dots because he’d left the paper we’re following. The papers sat there. Since the bundle wasn’t moving in space but only enduring in time, the dots simply rise up the page (in the temporal dimension) until Lester picked the bundle up. Lester was the paperboy. His paper route snaked through the neighborhood, and the black dot moved with Lester until he delivered the paper we’re tracking to Oot’s house on Dorothea Drive. The black dot representing the newspaper simply rises here, because it doesn’t leave the house. Lester went on to finish his route and return home. When Oot’s family finished with the paper they threw it out. The paper rises off the Day 1 page onto the bottom of the Day 2 page sitting in the garbage can (today this would be the appropriate recycling bin, another dramatic change). The entire snake on Day 2 is that of garbage truck #1135, Larry Mitchell’s. When Mitchell’s truck picked up the paper the black dot joined the truck’s route. Tim Hess complied the base map. Diane Pacella complied Lester’s route. I complied the other routes and drew the diagram.
Another map shows the buses passing through the neighborhood between 3:00 and 3:20 any weekday afternoon, time rising vertically again. Included here would be a map showing the same routes with the time collapsed out of them lying flat on the page.
Triangle Correctional Center (since closed) ran a bus of working prisoners through the neighborhood back to the prison. Capital Area Transit ran the old Boylan Heights route (since abandoned). Others would be school bus routes, two from one elementary school, one from a 6th grade center (since absorbed into a middle school), and one from a junior high (since turned into a middle school).
We also made maps of the other CAT bus routes, and a map of the mailman’s route.
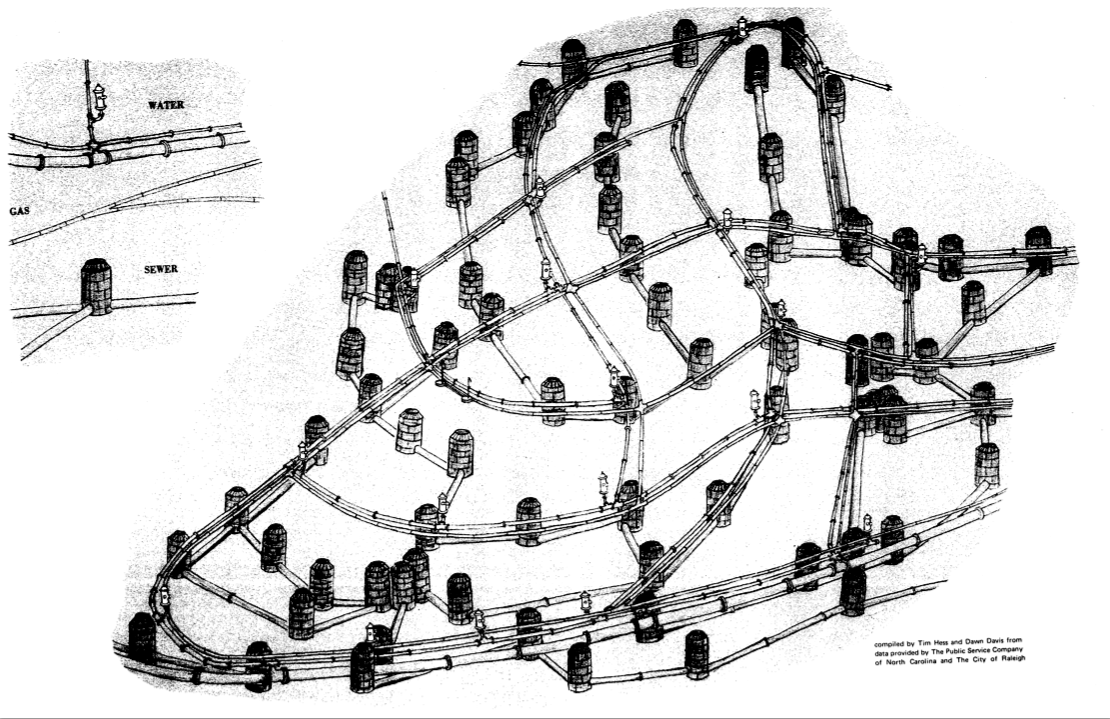
Underground Map (1.7mb PDF here)
Underground Map: Did we struggle to understand and represent the gas, water, and sewer systems! Dawn Davis and Tim Hess went down to the city and the gas company. They came back with the raw data, long linear maps of the streets and alleys. Tim then drafted many versions. Carter Crawford built on Tim’s work in his effort to combine all the data into a single image. It took him a lot of drafts. Most of the trials vanished into the wastebasket. I used the final image in The Power of Maps (p. 19), to make a point about the social construction of maps. It’s the most widely reproduced of the maps.
Boylan’s Hill Map: The problem with Boylan’s Hill was to get as much information as we could into the spread and still maintain some semblance of elegance. At the very least we wanted a contour image, but to make plainer what this means, a profile as well. Since the spread was in the general section, we also wanted to show something of the topography of the area surrounding Boylan’s Hill. We made a lot of stabs at this. We thought of making a model and photographing that, but Tanaka’s method for representing landform relief proved more than adequate. Jimmy Thiem did all the spade work for this spread, but the final work is Crawford’s.
All maps copyleft Denis Wood (2008).

Denis, I found the NPR broadcast some time ago and enjoyed it. This examples in this article are a true inspiration. Keep up the out-of-the-box thinking. Hope your upcoming book has found a good home.
Christian
Denis,
I took your classes in 1975/76. You taught me to read and read a lot and map many things. My years took me into mostly industrial processes, product development and user definable and intuitive needs, mental maps and emotional maps leading to product concepts. I have products in all Fords, Chryslers, GM, BMW, VW, Audi, Renault, Saab vehicles. With this in mind I have mental maps of visited gardens, landscapes, villages in Europe, Japan, Mexico, Canada. Finding your books hopefully will take me back into the landscape on foot and with pin and data collectors in hand. Maps of the flimsy urban explosions eating our lands may awaken our children that there really was something ‘there’ before this infectious greed that is molding our landscapes checkmates their ability to simply enjoy land. Perhaps Olmstead truely understood and reached so magnificently deep when designing Central Park and Biltmore. I’ll be reading you…a lot.
Chiao,
Coop
Hello Denis –
This is great! What luck to stumble across your atlas. I love the star map among many others. It was brillliant meeting you in the Research Triangle, if you are coming to Paris or Chicago drop me a line, I am sometimes in either city. All the best,
Brian Holmes
Dear Dennis Wood – I am involved with a group of artists here in South West Scotland organising an exhibition on the theme of ‘Books of Place, Memory and Identity’. The first stage is to invite central participants (and then open it out to general submissions). I know the Boylan Heights Book is not yet published, but I wish it was and the work fits the theme! If you were interested – thats the most important bit – is there an easy way for us to obtain and exhibit sheets, a bit like the photo at the head of the feature on the project? I can send more information if you are interested. Whatever, the project is truly inspiring. Thank you! and may it proliferate.
With good wishes
Julian Watson
[…] go from being a bunch of stuff in a box under his desk to one of the most popular episodes of TAL: Denis Wood: A Narrative Atlas of Boylan Heights « Making Maps: DIY Cartography There was a lot we wanted to do. Certainly we wanted to use the mapping to help us figure out what […]
[…] have liked to. One in particular had to do with NC’s Master Address Data Set. Another was Denis Wood’s presentation about community mapping and psycho-geographic information systems. And I also missed […]
[…] Denis Wood: A Narrative Atlas of Boylan Heights « Making Maps: DIY Cartography "Inspired by Bill Bunge’s radical cartography in the 1960s and 1970s, the atlas contains diverse examples of creative, place-inspired maps, including maps of night, crime, fences, graffiti, textures, autumn leaves, routes, the underground, lines overhead, stars, and jack-o-lanterns. The atlas is of particular interest to those engaged in planning, urban history, urban geography, landscape architecture, participatory mapping and GIS, subversive cartography, counter-mapping, and psychogeography. Or anyone who enjoys creative mapping." (tags: mapping landscape community storytelling) Share and Enjoy: […]
I sent a message recently via (not having any other) this route to Denis. I need to report back to my committee that he’s got it, even he cannot immediately act on it (a request for info and plates from the Boylan Heights atlas). Could we have an acknowledgement, however brief? Things revving up in the exhibition department here….
With all good wishes
Julian Watson
[…] This neighborhood is made of streets with names and other stuff without names – Boylan heights (research by denis wood, nc state) – can listen to this at This American Life, episode 110. What do the maps mean? Jack-o-lanterns […]
[…] sounds, as well as a few texture collection expeditions (inspired, in part, by Denis Wood’s Narrative Atlas of Boylan Heights […]
[…] Denis Wood’s Atlas of Boylan Heights […]
[…] Denis Wood: A Narrative Atlas of Boylan Heights […]
[…] favorite geographer worth linking to is Dennis Woods. situationalism brough us the […]
ABSTRACT
“In the Empire in question, the Cartographer’s Art reached such a degree of Perfection that the map of a single Province took up an entire City, and the map of the Empire covered an entire Province. After a while thse Outsized Maps were no longer sufficient, and the Schools of Cartography created a Map of the Empire that was the size of the Empire, matching it point by point. . . No other relics of Geographic Discipline can be found anywhere else in the land.” – Jorge Luis Borges, 1968 – On Scientific Rigor
Thank you Denis for introducing me to Concepts of Space almost two decades ago when studied at the School of Design (now College of Design) at NCSU. Then, I did not complete some of the writing but I enjoyed taking your class and reading the books. Today, I look back on those days of sophomoric discourse (I was in my second year of studies) as a fundamental block of knowledge to help me in both civilian and military studies. Tomorrow, I hope to emulate your scholarship with some works of my own.
v/r
Ralph
http://www.linkedin.com/in/stantonsolutionsllc
[…] the 1960s. Wood too was influenced by the Detroit Geographical Expedition; his as yet uncompleted Narrative Atlas of Boylan Heights is directly influenced by Bunge in terms of scale, subject matter, and cartographic […]
[…] Dennis Wood […]
[…] https://makingmaps.net/2008/01/10/denis-wood-a-narrative-atlas-of-boylan-heights/ […]
Mapping two dozen years of public service architecture/urban design; new, old, and little houses, trees, stairs on streets, and streets that need them; parks for food, rocks for marks, murals on walls, and visions unrealized; rosebud bars, swimming the edge, and how they all taught me the city and county.
[…] Denis Wood […]
[…] This next little black map represents the pumpkins that can be found here. It represent all the pumpkin lanterns that can be found in a Boylan Heights neighborhood. The […]
[…] Dennis Wood’s narrative atlas of Boylan Heights. Mapping a neighbourhood through non-traditional cartographical features; pumpkins, street lights, sidewalks. […]
[…] makingmaps.net/2008/01/10/denis-wood-a-narrative-atlas-of-boylan-heights/ […]
[…] choose to exclude. He says that maps get their coherence through omission rather than inclusion. Denis Wood, a cartographer of Boylan Heights, intriguingly ignores all but the jack-o-lanterns, street signs, […]
[…] explanation of the different maps he did and how he collected the […]
[…] example, what does it mean when an address is frequently mentioned in the neighborhood newsletter – regardless of who lives […]
[…] his description of making the atlas, Wood talks about how the presentation of the atlas was designed to be reproduced cheaply on a […]
[…] https://makingmaps.net/2008/01/10/denis-wood-a-narrative-atlas-of-boylan-heights/ […]
[…] We did a dérive (“a technique of transient passage through varied ambiances”) to get a feel for the campus and its “resonances,” some blind-folded, ear-plugged tours through the campus (with me or one of the students leading the others along) collecting smells and sounds, as well as a few texture collection expeditions (inspired, in part, by Denis Wood’s Narrative Atlas of Boylan Heights project). […]
[…] Critical cartography appears to present a body of thought and practice often geared towards the alternative; a more multitudinous approach to mapping founded on creative interpretation and, often, interactivity. When it comes to the tools of social media and campaigning, Web 2.0 affords possibilities in interactivity in mapping such as collaborative map-making at the heart of projects like Open Street Map and some of the more radical forms of mapping explored by the likes of Denis Wood. […]
[…] Denis Wood: A Narrative Atlas of Boylan Heights […]
[…] recuperate their perhaps forgotten presence. Much as Denis Wood remapped the lived community of Boylan Heights not only as a place in Raleigh, North Carolina, but a community through a sequence of maps from […]