A cartogram varies the size of geographic areas based on the data values associated with each area. Typical cartograms scale geographic areas to population, GNP, electoral votes, etc.
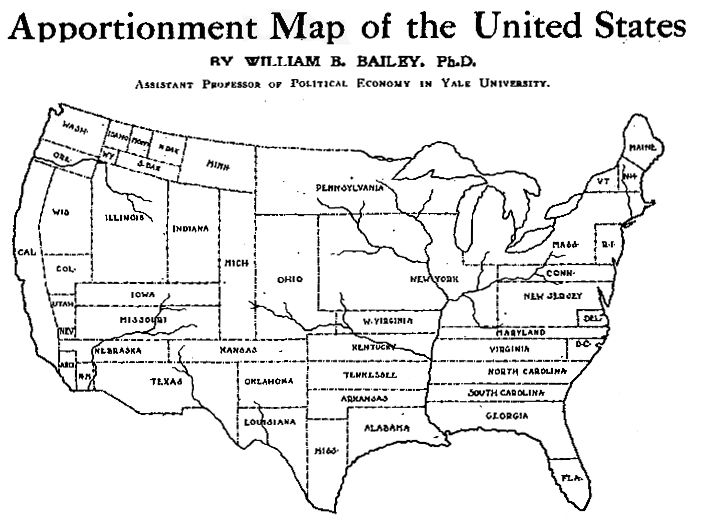
This “apportionment map,” as creator William B. Bailey (Professor of Political Economy, Yale University) calls it, scales the size of U.S. states to the size of their population (in 1910). Note that New York has colonized much of the upper Midwest.
The map, published April 6, 1911 in The Independent is one of the earliest cartograms I have seen.
Apportionment means “allotment in proper shares.” Thus, each state size is allotted based on population, not actual geographical area. Is a curious term to use, possibly more meaningful than the somewhat vague term “cartogram” (a “map diagram”).
Bailey writes:
The map shown on this page is drawn on the principle that the population is evenly distributed thruout the whole United States, and that the area of the States varies directly with their population. With the map constructed on this principle some curious changes become apparent. On the ordinary map the four States, Montana, Wyoming, Colorado, and New Mexico, together with the seven States which lie to the west of them, comprise more than one-third of the territory of the United States, and the area of each one of them is considerably larger than that of New York State; yet the population of New York State alone is nearly one-fourth larger than the combined population of these eleven Western States. In fact, the entire territory to the west of the Mississippi River contains only about 5 per cent. more people than are to be found in the New England States, together with New York, New Jersey, and Pennsylvania. Yet the territory at present covered by these nine Eastern States is only about two-thirds as large as the State of Texas. If we should add to these nine Eastern States the population of Ohio, the total would be greater by about three millions than the entire population west of the Mississippi. The State of Rhode Island, hardly visible to the naked eye on the ordinary map, now becomes almost as large as the territory of Utah and Arizona combined.
Were Texas as densely populated as is the State of Rhode Island, it would contain a population of nearly eighty-five millions, leaving only six millions of our people to be scattered thruout the rest of the country. Were the population of the United Stats as a whole as dense of that of Rhode Island this country would have more than a billion inhabitants.
