Feeds:
Posts
Comments

Posts Tagged ‘Counter Mapping’

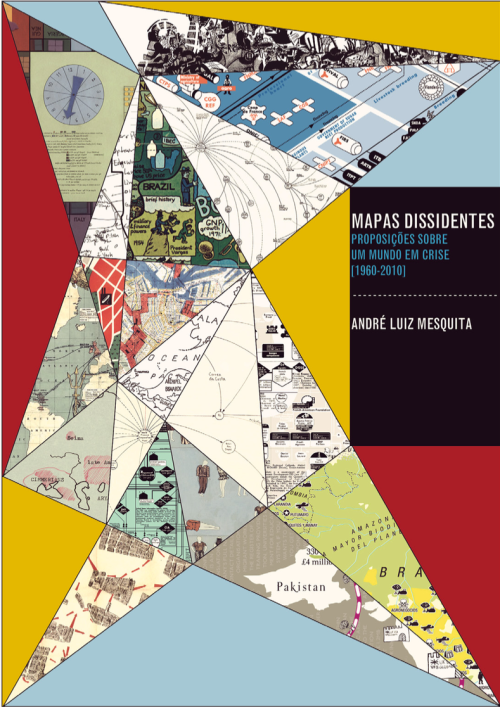
Cover of dissertation

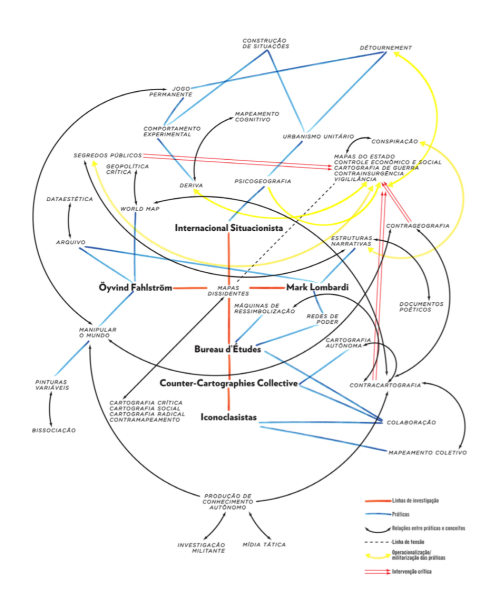
André Luiz Mesquita’s dissertation (in Portuguese), Mapas Dissidentes: Proposições Sobre um Mundo em Crise (1960-2010), (Dissenting Maps: Propositions on a World in Crisis, 1960-2010), looks at the maps and diagrams of artists and activists from 1960 to 2010, all working in social, political, and economic contexts of crisis and change, conflict and various forms of resistance. He approaches the work of three generations of artists through an analysis of endless documents, catalogs, manifestos, articles, photographs, documentaries, art works, reproductions of maps, and interviews.

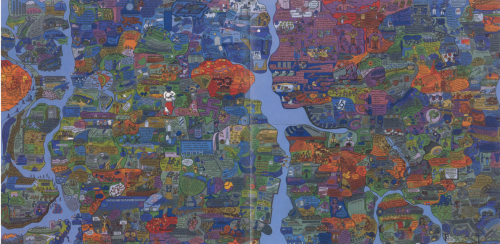
Mesquita begins by examining the games and maps created in the 1960s and ’70s by the Swedish-Brazilian artist, Öyvind Fahlström (1928-1976), made under the geopolitical tensions of the Cold War (1947-1991) and the structural and organizational changes in global capitalism of the 1970s.

Öyvind Fahlström's World Map

Öyvind Fahlström’s World Map

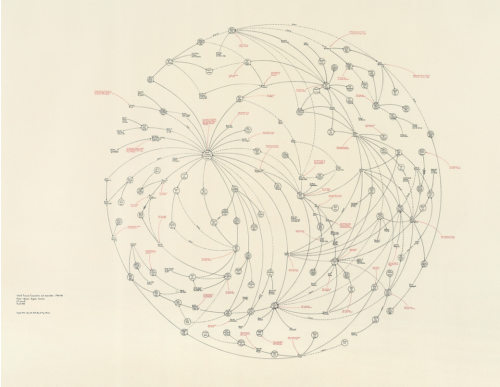
He then turns to the work of the American artist, Mark Lombardi (1951-2000), who, in the 1990s, mapped international power networks and obscure financial transactions involving banks, governments, and neoliberal elites.

Mark Lombard's World Finance

Mark Lombard’s World Finance

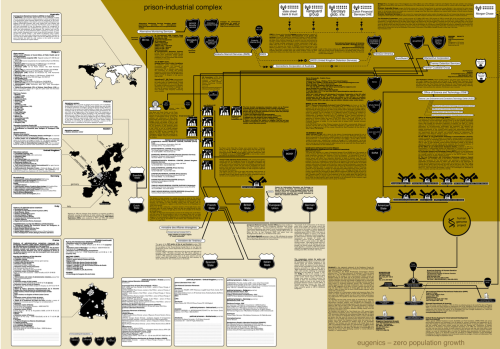
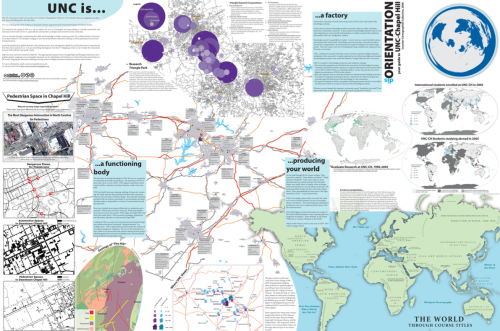
Finally Mesquita addresses the counter-cartography practices developed between the 1990s and 2010’s by three activist art collectives: Bureau d’Études (France), the Counter-Cartographies Collective (United States), and Iconoclasistas (Argentina). Based on the interrelations between contemporary art, political activism, and critical cartography, Mesquita holds that the work of these activists-artists has created a significant opposition to the “neutral and objective” maps made in the interests of corporate, governmental, and military bodies.

Bureau de'Etudes's Refuse the Biopolice

Bureau de’Etudes’s Refuse the Biopolice

•••••

Counter-Cartographies Collective's DisOrientation Guide

Counter-Cartographies Collective’s DisOrientation Guide

•••••

Iconoclasistas' Radiografía del Corazón del modelo sojero

Iconoclasistas’ Radiografía del Corazón del Modelo Sojero

What’s really exciting is the mining Mesquita has done, coming up with a range of map work that will surprise the causal observer of, say, Fahlström (in particular); but also the way he attaches all this work to that of antecedents (like the Surrealists and the Situationists) and parallels (as in the work of Trevor Paglen).

Structure of the dissertation's argument

Map of the Dissertation’s Argument

This is an important piece of work. Mesquita is currently working on a translation to English.

The full dissertation can be downloaded here or here (55.4 mb)
Contact André Luiz Mesquita

Read Full Post »

•••••

That a cartographer  could set out on a mission that’s so emotional, so personal, so idiosyncratic, was news to me.    

—Ira Glass, host of This American Life


•••••

Everything Sings: Maps for a Narrative Atlas by Denis Wood with an introduction by Ira Glass. Pub date: Nov. 12.
$28  .  Paper  .  112 pages  .  85 black and white illustrations, including more than 50 maps  .  ISBN: 978-0-9799562-4-9

Preorder

•••••

These maps remind me of all the radio stories I love most. After all, most radio is a boring salaryman, waking up before you and me to announce the headlines or play the hits to some predetermined demographic. Yet some radio stories elbow their way into the world in defiance of that unrelentingly practical mission, with the same goal Denis Wood’s maps have: to take a form that’s not intended for feeling or mystery and make it breathe with human life. —Ira Glass, host of This American Life

•••••


From the Publisher:
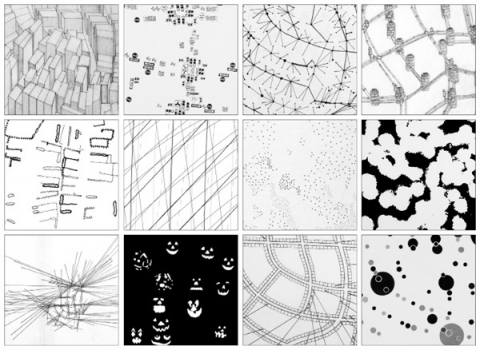
Denis Wood has created an atlas unlike any other. Surveying Boylan Heights, his small neighborhood in North Carolina, he subverts the traditional notions of mapmaking to discover new ways of seeing both this place in particular and the nature of place itself. Each map attunes the eye to the invisible, the overlooked, and the seemingly insignificant. From radio waves permeating the air to the location of Halloween pumpkins on porches, Wood searches for the revelatory details in what has never been mapped or may not even be mappable. In his pursuit of a “poetics of cartography,” the experience of place is primary, useless knowledge is exalted, and representation strives toward resonance. Our perception of maps and how to read them changes as we regard their beauty, marvel at their poetry, and begin to see the neighborhoods we live in anew. Everything Sings weaves a multi-layered story about one neighborhood as well as about the endeavor of truly knowing the places which we call home.


See the Siglio Press Facebook page with seven of the Atlas maps.


The Press Release for Everything Sings.

See the previous post (on the Making Maps blog): Denis Wood: A Narrative Atlas of Boylan Heights


Read Full Post »

bunge_runovermap.jpg

When Bill Bunge mapped out the locations of car/pedestrian collisions in Detroit (Detroit Geographical Expedition, 1968) he and the map were advocating a way of thinking about what was happening to the black community in Detroit – and advocating for change.

All maps advocate.

To advocate means to “to speak or write in favor of; support or urge by argument; recommend publicly.” The word derives from the Latin advocate: “to call to one’s aid.”

What map does not advocate, or argue for something? We are always calling maps to our aid.

Three free books on maps and advocacy have been made available for download recently, and are worth a look.

•••••

Two New PDF Books [added June 6 2009]:

Good Practices in Participatory Mapping (2mb PDF here, 2009). Published by International Fund for Agricultural Development.

A review of participatory mapping methods.

This report will review existing knowledge related to participatory mapping and recent developments. Specifically:

  • Section 1 will define the main features of participatory mapping;
  • Section 2 will discuss key applications of participatory mapping;
  • Section 3 will present specific tools used in participatory mapping, including their strengths and weaknesses;
  • Section 4 will identify good practices and explore the significance of process in participatory mapping initiatives.

participatorymapping

•••••

Toolbox & Manual: Mapping the Vulnerability of Communities (4.4mb PDF English version here, Portuguese version aqui, 2008). Published by Salzburg University Centre for Geoinformatics.

A overview of concepts and methods for community mapping, focused on vulnerability.

Within the research and project context it is aimed to provide the local communities with appropriate maps of their communities. The maps should enhance planning and decision making processes within the communities in regard to reduce local vulnerabilities and allow appropriate planning of disaster response measures. It is the first time in Mozambique that maps have been produced with such an accuracy (high resolution data) and for disaster risk management through the integration of participatory practices.

mappingvulnerability

•••••

•••••

Visualizing Information for Advocacy: an Introduction to Information Design (7mb PDF here, January 2008). Published by Tactical Technology Collective.

Succinct, well-designed, with many good examples of maps and information graphics for advocacy.

…a manual aimed at helping NGOs and advocates strengthen their campaigns and projects through communicating vital information with greater impact. This project aims to raise awareness, introduce concepts, and promote good practice in information design – a powerful tool for advocacy, outreach, research, organization and education.

vifa1

vifa2

•••••

Maps for Advocacy: An Introduction to Geographic Mapping Techniques (3mb PDF here, September 2008). Published by Tactical Technology Collective.

A great overview of maps and advocacy with many examples and resources.

The booklet is an effective guide to using maps in advocacy. The mapping process for advocacy is explained vividly through case studies, descriptions of procedures and methods, a review of data sources as well as a glossary of mapping terminology. Scattered through the booklet are links to websites which afford a glance at a few prolific mapping efforts.

mfa1

mfa2•••••

Field Guide for Humanitarian Mapping (3.2mb PDF here, March 2009). Published by MapAction.

A textbook for using maps and GIS in humanitarian work.  The Guide provides detailed information on data collection (GPS) and the use of Google Earth and MapWindow (free mapping software).

The guide was written to meet the need for practical, step-by-step advice for aid workers who wish to use free and open-source resources to produce maps both at field and headquarters levels. The first edition contains an introduction to the topic of GIS, followed by chapters focused on the use of two recommended free software tools: Google Earth, and MapWindow. However much of the guidance is also relevant for users of other software.

fghm1 fghm2

•••••

Some related resources:

Read Full Post »

Making maps to counter prevailing assumptions and beliefs is a well established tradition.  Counter mapping, radical mapping, protest mapping … the map proposes an alternative.  Bolstered by its authoritative aura, the map can be quite convincing.

Geographers John Agnew, Thomas Gillespie, and Jorge Gonzalez, with Political Scientist Brian Min (all of UCLA) propose an alternative to the mantra – repeated by just about all on the political Right and Left – that the Iraq “Surge” has succeeded.

Agnew and his colleagues argue that the celebrated decline in violence in Baghdad is actually the result of inter-ethnic cleansing which began prior to the “Surge.”  And this counter-proposal about the “Surge” is bolstered by a garrison of maps.

Counter-mapping the “Surge” depends on a relatively mundane set of meteorological satellite data, ironically generated by the Defense Meteorological Satellite Program – Operation Linescan System (KMSP-OLS). Nighttime light is one kind of data collected by this program.

Nighttime light certainly suggests population patterns – we have all seen the global maps of nighttime light – and also access to electricity.

Agnew and his colleagues asked a relatively simple question that can be answered with a series of maps based on the KMSP-OLS data: how has emitted nighttime light in Baghdad changed as U.S. Military strategy in Iraq changed?

The study area consists of the ten security districts in Baghdad, here indicated on a Landsat ETM satellite image.

Nighttime light imagery was selected and analyzed for dates after the U.S. invasion of Iraq (November 16, 2003, 9pm), before the “Surge” (March 20, 2006, 9pm), and after the “Surge” (March 21 and December 16, 2007, both 9pm).

The results seem to contradict proclamations of the success of the “Surge.” In general, Baghdad’s nighttime light increased between the initial U.S. invasion and mid 2006, then begins a rapid decline prior to the implementation of the “Surge” strategy.

Even more interesting, the mid-2006 decrease in nighttime light is not evenly distributed in Baghdad.  The areas of declining nighttime light correspond with areas of ethnic violence and cleansing as documented in the Jones Report and its maps.

The greatest decline is in East and West Rashid – historically mixed Sunni and Shia – but also Adhamiya (Sunni), Kadamiya (Shia), Rusafa, and Karada (mixed and Sunni).  No change was observed in Sadr City (Shia), New Baghdad (Shia), Karkh (Green Zone), and Al Mansour (historically mixed but heavily Sunni by late 2007). This is certainly easier to see on a map:

Agnew and his colleagues conclude:

Our findings suggest that … the surge has had no observable effect, except insofar as it has helped to provide a seal of approval for a process of ethno-sectarian neighborhood homogenization that is now largely achieved but with a tremendous decline in the extent of residential intermixing between groups and a probable significant loss of population in some areas.

Furthermore, the nighttime light signature of Baghdad data when matched with ground data provided by the report to the US Congress by Marine Corps General Jones and various other sources, makes it clear that the diminished level of violence in Iraq since the onset of the surge owes much to a vicious process of inter-ethnic cleansing.

Disagree?  Raise your own army of data and maps to counter this counter-“Surge” proposition.

The text of Agnew, Gillespie, Gonzalez, and Min’s article “Baghdad Nights: Evaluating the U.S. Military ‘Surge’ Using Nighttime Light Signatures” is, for review and educational purposes, here.

Read Full Post »