Feeds:
Posts
Comments

Posts Tagged ‘maps’

tenement-header.jpg

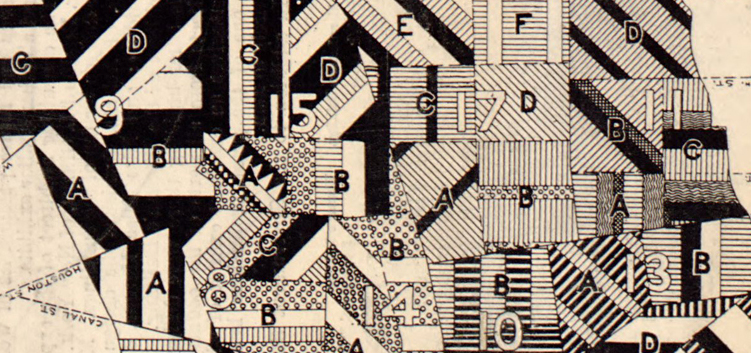
Map of New York City, Showing the Distribution of the Principal Nationalities by Sanitary Districts published in Harper’s Weekly (January 5, 1895, pp. 60–61) using 1890 U.S. Census data.

This map looks great, revealing a substantial amount of information with its intense, juxtaposed patterns.

The textures on the map show the relative amounts of different nationalities (qualitative data) in each of the areas (sanitary districts) on the map:

tenement_map_legend.jpg

The map shows if a district has more or less diversity (more or fewer lines of different textures), the relative proportions of different nationalities, the nationalities themselves, and, at a broader scale, the districts that are similar or differ in their nationality constitution. Because of the careful rotation of the lines of textures, the different sanitary districts can also be distinguished from each other.

(more…)

Read Full Post »

rgada_1209.jpg

Making maps is rife with rules. But following rules does not necessarily produce a great (or even good) map. It may be the implementation of broader design principles that leads to a successful map.

Principles are an intellectual generalization of a broad field of knowledge: a kind of map, in the broadest sense of the word.

They are useful for guiding map makers and helping map users understand how maps work.

There are numerous sets of cartographic design principles. My previous post on Edward Tufte distilled six map design principles (or commandments as I called them) from Tufte’s first book, The Visual Display of Quantitative Information.

In 1999 the British Cartographic Society’s Design Group proposed “Five Principles of Cartographic Design.” When I first came across this set of principles I thought them interesting – even a bit passionate – a rare state of affairs in the often stoic world of cartography. I added a few maps and my own comments (in italics).

More on these map design principles below: Concept before Compilation, Hierarchy with Harmony, Simplicity from Sacrifice, Maximum Information at Minimum Cost, and Engage the Emotion to Engage the Mind.

Cool maps below include: Geo-Smiley Terror Spree Map, The Continents and Islands of Mankind, Hate Groups and Hate Crimes Map, and Where Commuters Run Over Black Children, Detroit 1968.
(more…)

Read Full Post »

weather-map-of-billys-bed.jpg

Deane Powell | Life | December 1, 1910

Read Full Post »

publico-boylan-atlas.jpg

Denis Wood, co-author of Making Maps, has been working on an atlas of the Boylan Heights neighborhood in Raleigh, North Carolina since the mid 1970s. The atlas, which has never been published in its entirety, is called Dancing and Singing: A Narrative Atlas of Boylan Heights.

Inspired by Bill Bunge’s radical cartography in the 1960s and 1970s, the atlas contains diverse examples of creative, place-inspired maps, including maps of night, crime, fences, graffiti, textures, autumn leaves, routes, the underground, lines overhead, stars, and jack-o-lanterns. The atlas is of particular interest to those engaged in planning, urban history, urban geography, landscape architecture, participatory mapping and GIS, subversive cartography, counter-mapping, and psychogeography. Or anyone who enjoys creative mapping.

wood_boylanatlas_signs.png

Sign Map (736kb PDF here)

The Atlas has been featured on NPR’s This American Life and in Katharine Harmon’s book You Are Here. All or or parts of the atlas have been shown at The Brattleboro Museum and Art Center, Brattleboro, Vermont (1989), the Tang Teaching Museum at Skidmore College in Saratoga Springs, New York (2001), at SCI-Arc in Los Angeles (2002), at Colby-Sawyer College in New London, New Hampshire (2002), at designbox in Raleigh, North Carolina (2004), and Publico Galleries in Cincinnatti, Ohio (2007). The image which opens this entry was taken at the Publico Gallery.

A description of the atlas by Denis and more of it’s maps follow.

(more…)

Read Full Post »

« Newer Posts