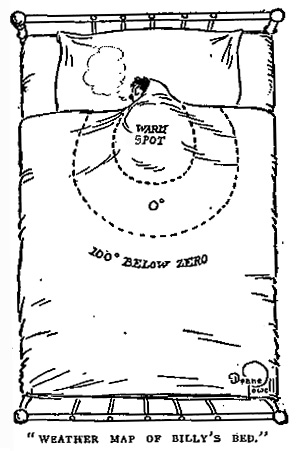
Deane Powell | Life | December 1, 1910
Posted in 01 What's A Map?, 03 Mappable Data, Map Cartoons, Map History, tagged Cartoons, maps, Weather Maps on January 22, 2008| 5 Comments »
Posted in 09 Map Symbolization, Map History, tagged coastlines, map symbols, nautical maps on January 17, 2008| 1 Comment »
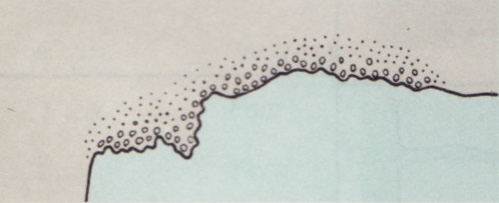
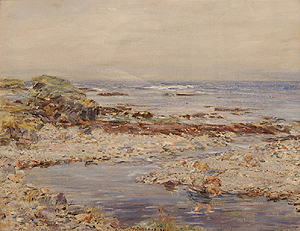
Ah, the shingly shore…
William McTaggart, A Shingly Shore, oil on canvas, 1904.
The nature of the coast: steep, flat, cliffy, rocky, sandhills, stony, shingly, sandy, mangrove, mud, gravel, coral, breakers, rubble, unsurveyed.
The nautical chart map symbol for a shingly shore is taken from section A of Chart #1, Nautical chart symbols and abbreviations used by U.S. Lake Survey, Corps of Engineers, U.S. Army, Dept. of Defense; U.S. Coast and Geodetic Survey, Dept. of Commerce; U.S. Navy Hydrographic Office, Dept. of Defense (Washington DC, 1957). The entire page A with the rest of the symbols is here (1.2 mb jpg). A contemporary version of these symbols, still Chart #1, is here.
Posted in 04 Map-Making Tools, 09 Map Symbolization, 10 Type on Maps, Map History on September 12, 2007| 5 Comments »

Map-making has often adapted technologies designed for purposes other than making maps.
I recall Scitex hardware as the state-of-the-art in large format color computer mapping in the early 1980s when I was first learning cartography. Cartography applications were developed when Scitex, its origins in designing and printing textiles, noticed “the similarity between printing large fabric surfaces and coloring topographic surfaces.” (PDF source).
Step back a few generations and we find the then ubiquitous typewriter adapted to making maps by DIY cartographers.
Posted in 09 Map Symbolization, Map History on August 21, 2007| 4 Comments »
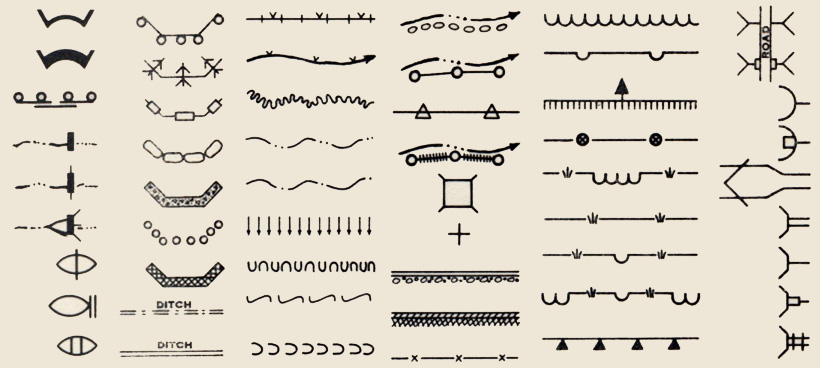
Dams, bulkheads, arches, ditches, flumes, outlet spreaders, outlet baffles, revetments, riprap, fence, gullies, borings, test pits, siphons, retaining walls, culverts, inlet transitions, jump structure, overfall, tree plantings, sheet erosion plantings, streams, lakes, terraces, ground water, water seepage, water limits, drains, percolators … the language of erosion and flood control in 1930s America.
The above symbols are selected from five pages (full PDF below) in Symbols and Instructions for Maps and Plans, a book compiled and published by the U.S. Department of the Interior Office of Indian Affairs in 1941.
Posted in 01 What's A Map?, Map History on August 8, 2007| 2 Comments »
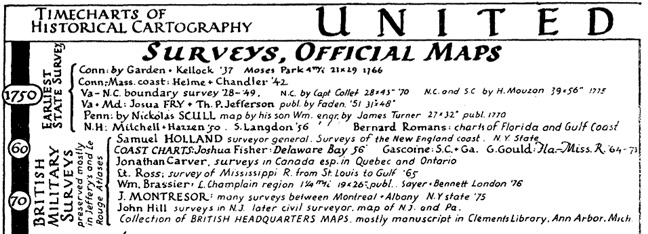
Harvard’s Erwin Raisz (1893-1968) was one of the 20th century’s preeminent cartographers (bio, bio, bio). Most people know of his landform maps, which are still in print. Raisz was also responsible for a series of atlases and hundreds of maps in books and academic articles.
In a 1937 article for the journal Isis entitled “Outline of the History of American Cartography” Raisz generated a pair of “timecharts of historical cartography” covering key events and individuals in American cartographic history, subdivided into official maps/surveys and private cartography.
Excerpts of the charts, for educational purposes, are linked below.
Posted in 09 Map Symbolization, Map History on July 19, 2007| 15 Comments »
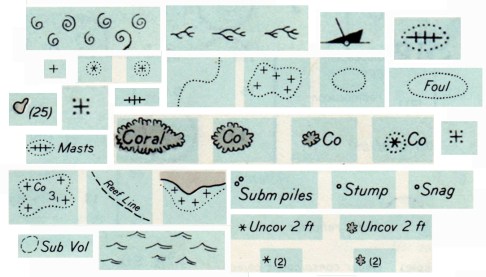
Rock which does not cover,
Coral reef, detached,
Wreck always partially submerged.
A number of sunken wrecks,
Obstruction of any kind,
Limiting danger line.
Foul ground, discolored water,
Position doubtful,
Existence doubtful.
Old map symbols and their descriptions can be poetic, enjoyable to view and read while providing ideas for symbols on contemporary maps. Indeed, is it possible that “maps are poems and poems are maps?” (see Howard Veregin’s “Geo-Poesy.”
Good map designers and map makers always look at other maps, including old maps, for map design ideas.
These symbols and textual descriptions of nautical dangers are taken from section O of Chart #1, Nautical chart symbols and abbreviations used by U.S. Lake Survey, Corps of Engineers, U.S. Army, Dept. of Defense; U.S. Coast and Geodetic Survey, Dept. of Commerce; U.S. Navy Hydrographic Office, Dept. of Defense (Washington DC, 1957). The entire page O from which the symbols were taken is here. A contemporary version of these symbols, still Chart #1, is here.
Posted in 05 Geographic Framework, 08 Generalization & Classification, Map History on July 12, 2007| 1 Comment »
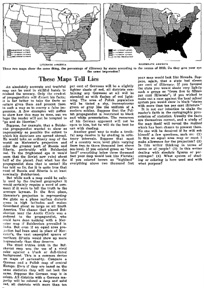
I was catching up on back issues of the magazine The Independent (the May 22, 1920 issue) and came across this historical tidbit entitled “These Maps Tell Lies.”
“An absolutely accurate and truthful map can be used in skillful hands to mislead the unwary. Only the crudest propagandists will distort his facts; it is far better to take the facts as nature gives them and present them in such a way to convey a false impression.”

