Feeds:
Posts
Comments

Posts Tagged ‘Cartograms – history’

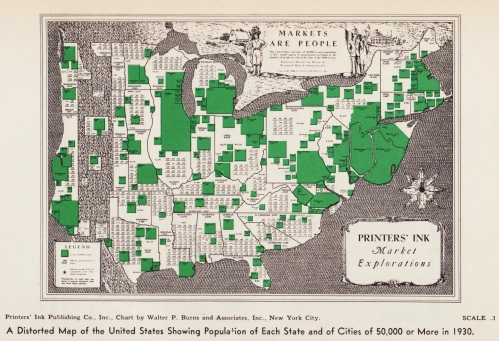
Cartogram, 1930: “A Distorted Map of the United States Showing Population of Each State and of Cities of 50,000 or More in 1930” (Printers’ Ink Publishing Co., Inc., Chart by Walter P. Burns and Associates, Inc., New York City)

A cartogram scales geographic areas to some value other than geographic area. In two previous blog posts, 1911 Cartogram: “Apportionment Map” and 1923 Patented Cartogram, a few old-school cartograms were resurrected from musty old publications. Here find eight more cartograms published between 1921 and 1938.

This post opens with a peculiar item – the U.S. states as well as the areas of major cities are scaled to population, in essence two cartograms together. Symbols representing “people living on farms” are scattered about, each symbol equal to a number (undisclosed) of persons. Weird.

From the Literary Digest in 1921:

Cartogram, 1921: “Relative Size of Each of the United States if Based on Electrical Energy Sold for Light and Power in 1921” (Literary Digest, April 23, 1921)

•••••••••••••••

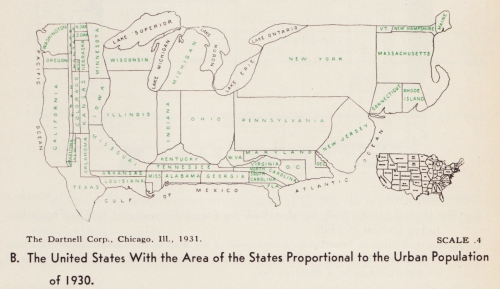
Cartogram, 1931: “The United States With the Area of the States Proportional to the Urban Population of 1930” (The Dartnell Corp., Chicago, Ill., 1931)

•••••••••••••••

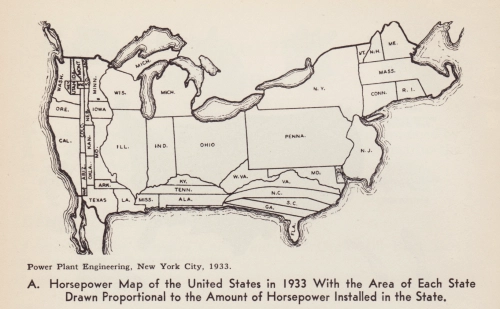
Cartogram, 1933: “Horsepower Map of the United States in 1933 With the Area of Each State Drawn Proportional to the Amount of Horsepower Installed in the State” (Power Plant Engineering, New York City, 1933)

•••••••••••••••

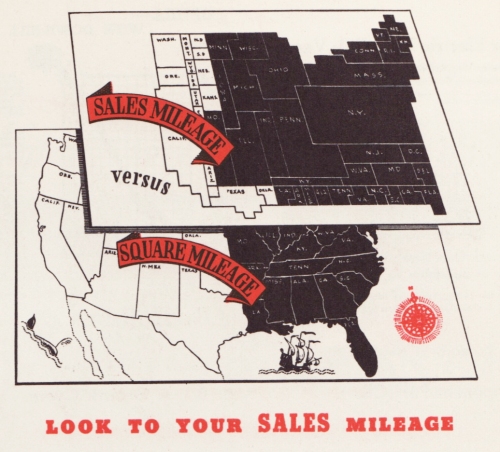
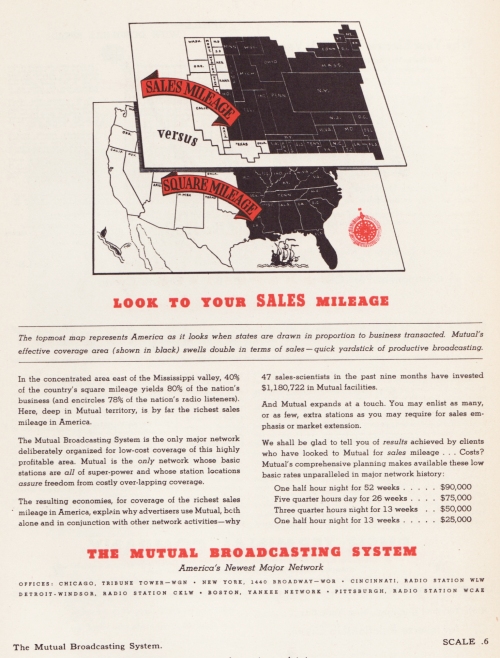
I had an old slide of the following cartogram but did not know its source: turns out it is from an advertisement for The Mutual Broadcasting Network, showing that 80% of business in the U.S. is transacted in states east of the Mississippi – MBN’s broadcasting area:

Cartogram, date unknown (1930s): “Look to Your Sales Mileage” advertisement (The Mutual Broadcasting System).

•••••••••••••••

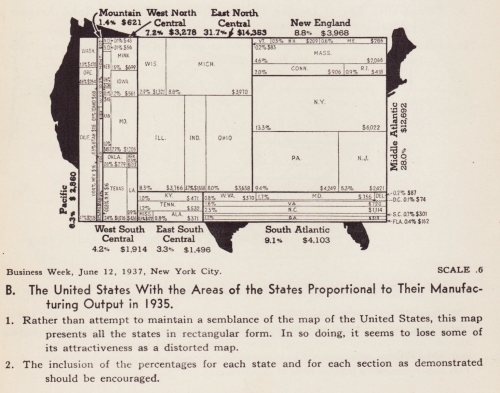
A very diagram-ish cartogram which places an un-cartogrammed map of the US in the background:

Cartogram, 1937: “The United States With the Areas of the States Proportional to Their Manufacturing Output in 1935” (Business Week, June 12, 1937, New York City)

•••••••••••••••

brinton_gp_cartograms_1938

Cartogram, 1938: “How Each State Shared in PWA Allotments for Non-Federal Power Projects as of July 1, 1937” (Public Utilities Fortnightly, February 3, 1938, Washington DC)

•••••••••••••••

Reproduced from Willard C. Brinton’s Graphic Presentation (1939).
Read Full Post »

pop_proj_alone_150

Stop making cartograms! At least until permission is granted from the chap who holds the patent on them.

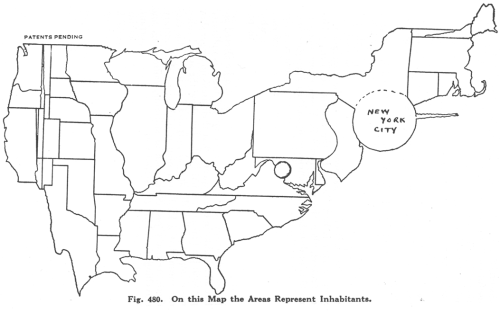
Karl Karsten’s “population projection” was published in his book Charts and Graphs (1923) and patented in 1925. As with the 1911 “Apportioinment Map” noted in an earlier post, the term “cartogram” was not used by Karsten to describe this creation.  He called it the “Population Projection.”

Curiously, it’s claimed that Karsten also invented the hedge fund.

But back to maps.

Karsten’s patent, (#1,556, 609, October 13, 1925) claimed rights to

…a map of a plurality of territories, having their boundary lines so distorted as to make their included areas represent graphically the relative importance of a given factor other than land area of one area with respect to another area, the boundaries being distorted without losing their familiar and significant features…

Karsten suggests using his “population projection” as a base upon which to map other data, such as truancy rates (below).  Thus it’s a bivariate cartogram (reproduced from p. 667 in Charts and Graphs):

truancy_popproj_150

The idea is good, but in practice it’s a bit wonky.  Several western US states are reduced to toothpick dimensions, and note the New York goiter (New York City). Also, Karsten seems to have some degree of difficulty maintaining the horizontal with the map and the legend. Could he have had an inner-ear infection?

But back to maps.

The illustration in Karsten’s patent reveals his methodology:

pop_proj_patentmap

Details of the methodology can be found in the text of the patent.

Karsten, in Charts and Graphs, explains the justification for using the “population projection” which is, more or less, the same line of argument used in current discussions of cartograms:

We do not sell our goods to the mountains, bill them to the rivers, or credit the forests with payment. Probably from at least a subconscious appreciation of this circumstance, many national distributors, advertisers, and sales-managers have discarded maps on which the rivers, forests or mountains are shown when they are studying the geographic distribution of their sales. The up-to-date sales manager lots his distributing points and records his sales in a great many ways upon maps which carry only faint State outlines or a the most show the location of larger cities. But why stop here? Your sales manager does not sell to square miles, acres, or other units of land-area measurement. He sells to human beings. Why should he use maps which show, not human beings, but square miles, that is, maps in which the areas indicate not the population but the land surface? Why indeed!

The result of this projection of the map of the United Statues upon a population basis rather than a land-area basis will be most surprising even to the most hardened travelers.

Needless to say, the picture of sales conditions which such a map exhibits, will be far more valuable and useful than the picture upon the usual land-area basis. In short, the corrected areas of the States serve to give an excellent background or evaluation of the importance of the statistics plotted upon the map.

The number of ways in which the map can be altered and projected for special purposes upon special bases is unlimited, but all are alike in one respect – that their areas no longer show physical land areas in square miles but show the actual values more important for the special purposes in view.

In 2005 a series of cartogram patents (here here here) failed to cite Karsten’s patent.

Read Full Post »