Feeds:
Posts
Comments

Archive for February, 2008

lat_long_globe.jpg

Maps and cartography are not particularly popular as song themes.

But there is the Longitude and Latitude Song (MP3 file here). Careful or you’ll be singing this one out loud in your cubicle.

Performed by Tom Glazer and Dottie Evans, and written by Hy Zaret, the song is one of a series of sciency tunes, aimed to inspire Sputnik-era kiddies, on the Space Songs album, recorded in 1959.

Jeff Poskanzer’s terrific Singing Science web page has all the tracks from Space Songs, as well as the tracks from subsequent albums Energy and Motion Songs (“Ultraviolet and Infrared”), Experiment Songs (“We Know the Air is There”), Weather Songs (“The Water Cycle Song”), Nature Songs (“Song of the Rocks”), and More Nature Songs (“What is an Animal”).

Absent from the albums are other potential map songs: “Which Datum Do You Use?” “Project Me,” “The Large Scale/Small Scale Polka,” “Your Love is like a Decorative Font,” “She’s Natural Breaks, I’m Quantiles,” and “The Symbols of my Love are Abstract Shapes in a Selection of Different Hues Corresponding to Qualitative Data Variation.” I’ll stop now.

A quick search of a few open-source music databases (FreeDB and MusicBrainz) results in hundreds of songs with map in the title. Not many latitude/longitude songs, though. There are also quite a few mappy band names: The Maps, Swell Maps, Maps and Diagrams, Maps of the Heart (blah!), Maps and Atlases, Relief Maps, The Plat Maps, Map, Map of Wyoming, Map of the World, Town Map, The Map, Map of Africa, Map of Hell, Penguin Map Mijinko, The Search Map, Book of Maps, Minus a Map, Map the Growth, Map of July, Days without Maps, Mind Maps, Maps of Norway, and Not on the Map.

The potentially evil, formerly-open-source music database Gracenote has a moderately interesting Music Maps page, which uses recent CD lookup data to map the geography of popular music.

And, of course, the excellent World Beat Music map of the world over at Strange Maps.

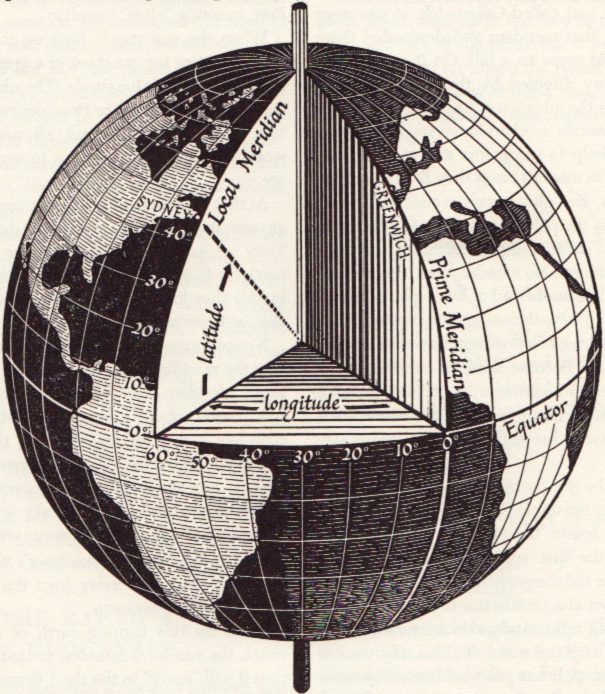
Latitude/longitude graphic from David Greenhood’s classic book Mapping.

Read Full Post »


cartogram-1911_title.jpg

A cartogram varies the size of geographic areas based on the data values associated with each area. Typical cartograms scale geographic areas to population, GNP, electoral votes, etc.

This “apportionment map,” as creator William B. Bailey (Professor of Political Economy, Yale University) calls it, scales the size of U.S. states to the size of their population (in 1910). Note that New York has colonized much of the upper Midwest.

The map, published April 6, 1911 in The Independent is one of the earliest cartograms I have seen.

Apportionment means “allotment in proper shares.” Thus, each state size is allotted based on population, not actual geographical area. Is a curious term to use, possibly more meaningful than the somewhat vague term “cartogram” (a “map diagram”).

Bailey writes:

The map shown on this page is drawn on the principle that the population is evenly distributed thruout the whole United States, and that the area of the States varies directly with their population. With the map constructed on this principle some curious changes become apparent. On the ordinary map the four States, Montana, Wyoming, Colorado, and New Mexico, together with the seven States which lie to the west of them, comprise more than one-third of the territory of the United States, and the area of each one of them is considerably larger than that of New York State; yet the population of New York State alone is nearly one-fourth larger than the combined population of these eleven Western States. In fact, the entire territory to the west of the Mississippi River contains only about 5 per cent. more people than are to be found in the New England States, together with New York, New Jersey, and Pennsylvania. Yet the territory at present covered by these nine Eastern States is only about two-thirds as large as the State of Texas. If we should add to these nine Eastern States the population of Ohio, the total would be greater by about three millions than the entire population west of the Mississippi. The State of Rhode Island, hardly visible to the naked eye on the ordinary map, now becomes almost as large as the territory of Utah and Arizona combined.

Were Texas as densely populated as is the State of Rhode Island, it would contain a population of nearly eighty-five millions, leaving only six millions of our people to be scattered thruout the rest of the country. Were the population of the United Stats as a whole as dense of that of Rhode Island this country would have more than a billion inhabitants.

(more…)

Read Full Post »

tenement-header.jpg

Map of New York City, Showing the Distribution of the Principal Nationalities by Sanitary Districts published in Harper’s Weekly (January 5, 1895, pp. 60–61) using 1890 U.S. Census data.

This map looks great, revealing a substantial amount of information with its intense, juxtaposed patterns.

The textures on the map show the relative amounts of different nationalities (qualitative data) in each of the areas (sanitary districts) on the map:

tenement_map_legend.jpg

The map shows if a district has more or less diversity (more or fewer lines of different textures), the relative proportions of different nationalities, the nationalities themselves, and, at a broader scale, the districts that are similar or differ in their nationality constitution. Because of the careful rotation of the lines of textures, the different sanitary districts can also be distinguished from each other.

(more…)

Read Full Post »

rgada_1209.jpg

Making maps is rife with rules. But following rules does not necessarily produce a great (or even good) map. It may be the implementation of broader design principles that leads to a successful map.

Principles are an intellectual generalization of a broad field of knowledge: a kind of map, in the broadest sense of the word.

They are useful for guiding map makers and helping map users understand how maps work.

There are numerous sets of cartographic design principles. My previous post on Edward Tufte distilled six map design principles (or commandments as I called them) from Tufte’s first book, The Visual Display of Quantitative Information.

In 1999 the British Cartographic Society’s Design Group proposed “Five Principles of Cartographic Design.” When I first came across this set of principles I thought them interesting – even a bit passionate – a rare state of affairs in the often stoic world of cartography. I added a few maps and my own comments (in italics).

More on these map design principles below: Concept before Compilation, Hierarchy with Harmony, Simplicity from Sacrifice, Maximum Information at Minimum Cost, and Engage the Emotion to Engage the Mind.

Cool maps below include: Geo-Smiley Terror Spree Map, The Continents and Islands of Mankind, Hate Groups and Hate Crimes Map, and Where Commuters Run Over Black Children, Detroit 1968.
(more…)

Read Full Post »