Feeds:
Posts
Comments

lat_long_globe.jpg

Maps and cartography are not particularly popular as song themes.

But there is the Longitude and Latitude Song (MP3 file here). Careful or you’ll be singing this one out loud in your cubicle.

Performed by Tom Glazer and Dottie Evans, and written by Hy Zaret, the song is one of a series of sciency tunes, aimed to inspire Sputnik-era kiddies, on the Space Songs album, recorded in 1959.

Jeff Poskanzer’s terrific Singing Science web page has all the tracks from Space Songs, as well as the tracks from subsequent albums Energy and Motion Songs (“Ultraviolet and Infrared”), Experiment Songs (“We Know the Air is There”), Weather Songs (“The Water Cycle Song”), Nature Songs (“Song of the Rocks”), and More Nature Songs (“What is an Animal”).

Absent from the albums are other potential map songs: “Which Datum Do You Use?” “Project Me,” “The Large Scale/Small Scale Polka,” “Your Love is like a Decorative Font,” “She’s Natural Breaks, I’m Quantiles,” and “The Symbols of my Love are Abstract Shapes in a Selection of Different Hues Corresponding to Qualitative Data Variation.” I’ll stop now.

A quick search of a few open-source music databases (FreeDB and MusicBrainz) results in hundreds of songs with map in the title. Not many latitude/longitude songs, though. There are also quite a few mappy band names: The Maps, Swell Maps, Maps and Diagrams, Maps of the Heart (blah!), Maps and Atlases, Relief Maps, The Plat Maps, Map, Map of Wyoming, Map of the World, Town Map, The Map, Map of Africa, Map of Hell, Penguin Map Mijinko, The Search Map, Book of Maps, Minus a Map, Map the Growth, Map of July, Days without Maps, Mind Maps, Maps of Norway, and Not on the Map.

The potentially evil, formerly-open-source music database Gracenote has a moderately interesting Music Maps page, which uses recent CD lookup data to map the geography of popular music.

And, of course, the excellent World Beat Music map of the world over at Strange Maps.

Latitude/longitude graphic from David Greenhood’s classic book Mapping.


cartogram-1911_title.jpg

A cartogram varies the size of geographic areas based on the data values associated with each area. Typical cartograms scale geographic areas to population, GNP, electoral votes, etc.

This “apportionment map,” as creator William B. Bailey (Professor of Political Economy, Yale University) calls it, scales the size of U.S. states to the size of their population (in 1910). Note that New York has colonized much of the upper Midwest.

The map, published April 6, 1911 in The Independent is one of the earliest cartograms I have seen.

Apportionment means “allotment in proper shares.” Thus, each state size is allotted based on population, not actual geographical area. Is a curious term to use, possibly more meaningful than the somewhat vague term “cartogram” (a “map diagram”).

Bailey writes:

The map shown on this page is drawn on the principle that the population is evenly distributed thruout the whole United States, and that the area of the States varies directly with their population. With the map constructed on this principle some curious changes become apparent. On the ordinary map the four States, Montana, Wyoming, Colorado, and New Mexico, together with the seven States which lie to the west of them, comprise more than one-third of the territory of the United States, and the area of each one of them is considerably larger than that of New York State; yet the population of New York State alone is nearly one-fourth larger than the combined population of these eleven Western States. In fact, the entire territory to the west of the Mississippi River contains only about 5 per cent. more people than are to be found in the New England States, together with New York, New Jersey, and Pennsylvania. Yet the territory at present covered by these nine Eastern States is only about two-thirds as large as the State of Texas. If we should add to these nine Eastern States the population of Ohio, the total would be greater by about three millions than the entire population west of the Mississippi. The State of Rhode Island, hardly visible to the naked eye on the ordinary map, now becomes almost as large as the territory of Utah and Arizona combined.

Were Texas as densely populated as is the State of Rhode Island, it would contain a population of nearly eighty-five millions, leaving only six millions of our people to be scattered thruout the rest of the country. Were the population of the United Stats as a whole as dense of that of Rhode Island this country would have more than a billion inhabitants.

Continue Reading »

tenement-header.jpg

Map of New York City, Showing the Distribution of the Principal Nationalities by Sanitary Districts published in Harper’s Weekly (January 5, 1895, pp. 60–61) using 1890 U.S. Census data.

This map looks great, revealing a substantial amount of information with its intense, juxtaposed patterns.

The textures on the map show the relative amounts of different nationalities (qualitative data) in each of the areas (sanitary districts) on the map:

tenement_map_legend.jpg

The map shows if a district has more or less diversity (more or fewer lines of different textures), the relative proportions of different nationalities, the nationalities themselves, and, at a broader scale, the districts that are similar or differ in their nationality constitution. Because of the careful rotation of the lines of textures, the different sanitary districts can also be distinguished from each other.

Continue Reading »

rgada_1209.jpg

Making maps is rife with rules. But following rules does not necessarily produce a great (or even good) map. It may be the implementation of broader design principles that leads to a successful map.

Principles are an intellectual generalization of a broad field of knowledge: a kind of map, in the broadest sense of the word.

They are useful for guiding map makers and helping map users understand how maps work.

There are numerous sets of cartographic design principles. My previous post on Edward Tufte distilled six map design principles (or commandments as I called them) from Tufte’s first book, The Visual Display of Quantitative Information.

In 1999 the British Cartographic Society’s Design Group proposed “Five Principles of Cartographic Design.” When I first came across this set of principles I thought them interesting – even a bit passionate – a rare state of affairs in the often stoic world of cartography. I added a few maps and my own comments (in italics).

More on these map design principles below: Concept before Compilation, Hierarchy with Harmony, Simplicity from Sacrifice, Maximum Information at Minimum Cost, and Engage the Emotion to Engage the Mind.

Cool maps below include: Geo-Smiley Terror Spree Map, The Continents and Islands of Mankind, Hate Groups and Hate Crimes Map, and Where Commuters Run Over Black Children, Detroit 1968.
Continue Reading »

weather-map-of-billys-bed.jpg

Deane Powell | Life | December 1, 1910

shingly_shore.jpg

Ah, the shingly shore…

mctaggart_shingly_shore.jpg

William McTaggart, A Shingly Shore, oil on canvas, 1904.

The nature of the coast: steep, flat, cliffy, rocky, sandhills, stony, shingly, sandy, mangrove, mud, gravel, coral, breakers, rubble, unsurveyed.

The nautical chart map symbol for a shingly shore is taken from section A of Chart #1, Nautical chart symbols and abbreviations used by U.S. Lake Survey, Corps of Engineers, U.S. Army, Dept. of Defense; U.S. Coast and Geodetic Survey, Dept. of Commerce; U.S. Navy Hydrographic Office, Dept. of Defense (Washington DC, 1957). The entire page A with the rest of the symbols is here (1.2 mb jpg). A contemporary version of these symbols, still Chart #1, is here.

publico-boylan-atlas.jpg

Denis Wood, co-author of Making Maps, has been working on an atlas of the Boylan Heights neighborhood in Raleigh, North Carolina since the mid 1970s. The atlas, which has never been published in its entirety, is called Dancing and Singing: A Narrative Atlas of Boylan Heights.

Inspired by Bill Bunge’s radical cartography in the 1960s and 1970s, the atlas contains diverse examples of creative, place-inspired maps, including maps of night, crime, fences, graffiti, textures, autumn leaves, routes, the underground, lines overhead, stars, and jack-o-lanterns. The atlas is of particular interest to those engaged in planning, urban history, urban geography, landscape architecture, participatory mapping and GIS, subversive cartography, counter-mapping, and psychogeography. Or anyone who enjoys creative mapping.

wood_boylanatlas_signs.png

Sign Map (736kb PDF here)

The Atlas has been featured on NPR’s This American Life and in Katharine Harmon’s book You Are Here. All or or parts of the atlas have been shown at The Brattleboro Museum and Art Center, Brattleboro, Vermont (1989), the Tang Teaching Museum at Skidmore College in Saratoga Springs, New York (2001), at SCI-Arc in Los Angeles (2002), at Colby-Sawyer College in New London, New Hampshire (2002), at designbox in Raleigh, North Carolina (2004), and Publico Galleries in Cincinnatti, Ohio (2007). The image which opens this entry was taken at the Publico Gallery.

A description of the atlas by Denis and more of it’s maps follow.

Continue Reading »

What are subversive cartographies? This issue is addressed a series of presentations organized by Chris Perkins (University of Manchester) and Jörn Seemann (Louisiana State University) for the upcoming 2008 Association of American Geographers meeting (Boston, April 15-19 2008).

“To be subversive, is to wish to overthrow, destroy or undermine the principles of established orders. As such subversive cartographies offer alternative representations to established social and political norms. Maps are no longer cast as mirrors of reality, instead they are increasingly conceived as diverse ways of thinking, perceiving and representing space and place which express values, world-views and emotions. Maps are no longer part of an elite discourse: they can empower, mystify, and enchant. More critical assessments of mapping increasingly explore subversive contexts strongly associated with innovative methodological approaches, with mapping seen as an explicitly situated form of knowledge. This shift has been strongly facilitated by the increasing popularity of new media, burgeoning technological change and newly developing mapping spaces (eg OpenStreetMap, WorldMapper and EmotionMap). So subversive mapping has an agency, which can be enacted outside existing cartographic conventions. It has escaped from the grasp of cartographers: everybody is mapping nowadays.” (edited from the original call for papers)

••••

Subversive Cartographies 1: Papers emphasizing the role of the aesthetic in the construction of alternative and artistic mappings. Common themes are the relations between artistic practice and mapping, narrative and (e)motional cartographies, and the politics of design.

Deconstructing Intentionally Manipulative Maps (IMMs)
Ian Muehlenhaus, University of Minnesota

Radical Cartography: Artists Making Activist Maps
Lize Mogel, Interdisciplinary Artist

Decolonizing Historical Cartography Through Narrative: Champlain’s Voyages Revisited
Margaret Wickens Pearce, Ohio University and Michael Hermann, University of Maine

Lynch Debord
Denis Wood, Independent Scholar

Discussant: Vincent J. Del Casino, California State University Long Beach

••••

Subversive Cartographies 2: Papers focus on the role of technologies and methodologies important in community engagement. Common themes include changing roles of the web, the emancipatory potential of GIS and ways of evaluating the aesthetic.

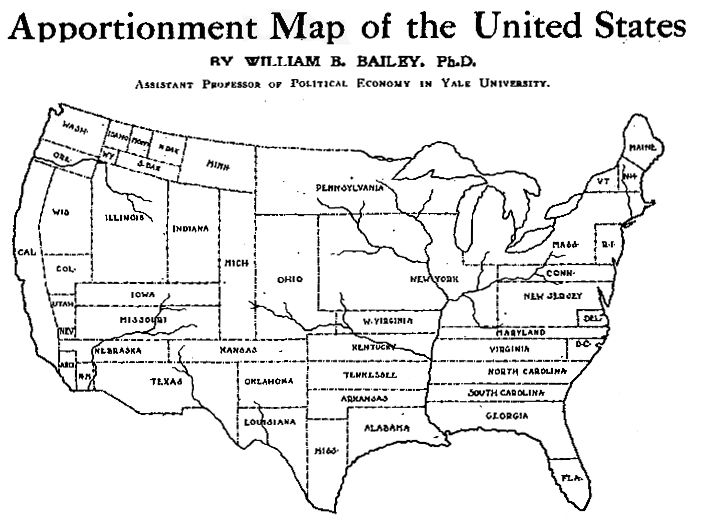
Subverting Civilization: Re-Mapping World History
Mellina Patterson and Stephen Hanna, University of Mary Washington

Small Voices Magnified: Using Web 2.0 for Mapping Alternative Australian Viewpoints
William Cartwright, RMIT University

Children with Physical Disabilities Map Neighbourhood Accessibility: Methodological Approaches
P. McKeever, and S. Ruddick, University of Toronto

“There is no community in Eastside”: GPS Tracks, Walking Interviews and Stories of Place
Phil Jones, University of Birmingham and James Evans, University of Manchester

Re-focusing on the Visual Politics and Practices of Grassroots GIS: Considering Subversive Potential and Limits
Sarah Elwood, University of Washington

••••

Subversive Cartographies 3: This final session focuses on more abstract aspects of subversion. Common themes include the ambiguities of the subversive, different ways of theorizing the medium and the practical, political and affectual potential of oppositional mapping.

Are Maps Autistic?
J.B. Krygier, Ohio Wesleyan University

“They have Stolen our Amazonia”: Internet Information Flows, Map Hoaxes and Nationalistic Sentiments in Brazil
Jörn Seemann, Louisiana State University

Subverting Carolina Blue: Mapping UNC-Chapel Hill through Drifting and DisOrientation
Craig Dalton, Counter Cartographies Collective UNC Chapel Hill

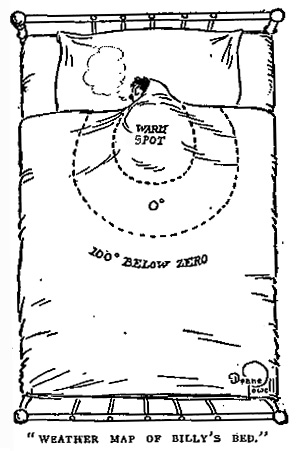
The Emotional Life of Maps and Other Visual Geographies
Jim Craine, California State University, Northridge and Stuart Aitken, San Diego State University

Discussant: Chris Perkins, University of Manchester

••••

Abstracts for Subversive Cartographies Presentations Below:

Continue Reading »

bomb-multiple.jpg

Google’s My Maps allows the easy creation of pseudo map mash-ups, where you can map your own data as points, lines, and area symbols with Google Maps as the background.

I wrote about My Maps – basic how-to and some of its limits – in another blog post, Allelopathic Maps & Google’s “My Maps.” One of the My Maps limits, the inadequate and corny set of available map symbols, has been removed: you can now create and use your own map symbols in My Maps.

To work with My Maps you need a Google account, and to use custom symbols (icons, as Google calls them) you need some server space to upload your symbols: you must provide a URL to the symbols. You should be able to find a free web hosting service that allows hot-linking (the placement of an image hosted on the free site in a My Maps map in this case). You can also embed images in the pop-up balloon associated with points, lines, and areas on My Maps, and you need server space to host those files.

In Custom Icons for Your Maps, a posting on the official Google Earth/Maps blog, PNG files with transparent backgrounds are recommended, although JPG and GIF should also work. PNGs and GIFs can have transparent backgrounds, essential if you don’t want a white box surrounding your symbol. As Google says PNG, lets PNG.

Continue Reading »

Making Flat Earth Globes

flat-earth1.jpg

What if the world was spherical, but it didn’t matter?

Most of you have been unable to avoid the flat-earth kerfuffle on the day-time talk show The View.

On a recent episode one of the hosts, Sherri Shepherd, said she doesn’t believe the theory of evolution. Whoopi Goldberg, also a host, asked Shepherd “Is the world flat?”

Shepherd’s response was “…I Don’t know. I… I never thought about it, Whoopi. Is the world flat? I never thought about it.”

Most maps show the earth as flat. Map projection is the process whereby the surface of the 3D earth is transformed into 2 dimensions. A flat earth is usually more useful than a spherical one.

Awhile back I made a flat-earth globe for folks like Ms. Shepherd. It is a globe designed for niche cosmologies.

More images and basic instructions for making your own flat-earth globe below.

Continue Reading »